CK-12 Foundation
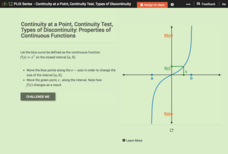
Continuity at a Point, Continuity Test, Types of Discontinuity: Properties of Continuous Functions
Take a closer look at continuous functions within given intervals. Using the parent cubic function, learners explore properties of continuous functions on intervals. Pupils interpret the Intermediate Value Theorem and the Extreme Value...
CK-12 Foundation
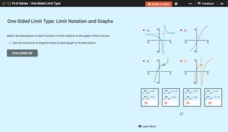
One-Sided Limit Type: Limit Notation and Graphs
A one-sided limit is no less important than a two-sided limit. Young mathematicians use an interactive to match limit notation to graphs. The exercise requires interpreting how one-sided limits connect to features of graphs.
CK-12 Foundation
Evaluate Limits Using Graphs and Tables: Evaluate the Limits
Discontinuities in the graph? No worries. Pupils investigate the limit of a function given graphically using an interactive. The graph has removable and jump discontinuities.
CK-12 Foundation
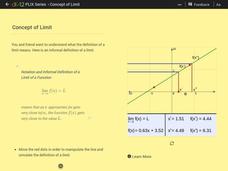
Concept of Limit
There's no limit to how useful the resource can be. Scholars use a slider interactive to investigate limits from graphs. They take both one-sided and two-sided limits into consideration.
CK-12 Foundation
Misleading Graphs (Identify Misleading Statistics): Are Virgos Cursed?
Is it safe to take data at its face value? Pupils use the interactive to evaluate a claim that Virgos are more likely to get into a car crash than others. Individuals determine whether another variable may be at play.
CK-12 Foundation
Function Rules based on Graphs: Making Money in the Hat Business
Hats off to those learning about the graphs of functions. Individuals use an interactive to plot points representing profits for a hat business. They identify a quadratic equation to represent this function and answer challenge questions...
CK-12 Foundation
Intercepts by Substitution: Finding a Linear Product Using a Quadratic
Discover another way to interpret multiplication. Using an interactive, learners slide points (representing the factors of multiplication) along the x-axis of the graph of y = x^2 and observe changes in the line segment connecting the...
CK-12 Foundation
Graphs Using Slope-Intercept Form: Zip-Line
Zip lines aren't so scary when all your scholars use them for is math. Young mathematicians see how the slope of a zip-line to a building changes as the height changes. They answer a set of challenge questions regarding the scenario.
CK-12 Foundation
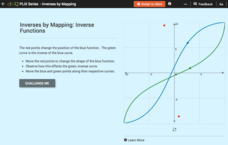
Inverses by Mapping: Inverse Functions
Map your way to successfully understanding inverse functions. Pupils use an interactive map to investigate how changes in the graph of a function affect the graph of its inverse. The results of the activity lead to the conclusion that...
California Education Partners
Linflower Seeds
How does your garden grow? Use proportions to help Tim answer that question. By using their understanding of proportional relationships, pupils determine the number of seeds that will sprout. They create their own linear relationships...
Mathematics Vision Project
Module 1: Sequences
Take steps into sequences. An 11-lesson unit builds upon pupils' previous understanding of writing expressions to develop the idea of sequences. The resource explores both arithmetic and geometric sequences using recursive and explicit...
Virginia Department of Education
Scatterplots
Math is all fun and games with this activity! Learners use an activity designed around hula hoops to collect data. They create scatter plots with their data and then analyze the graphs for correlation.
EngageNY
Constant Rates Revisited
Find the faster rate. The resource tasks the class to compare proportional relationships represented in different ways. Pupils find the slope of the proportional relationships to determine the constant rates. They then analyze the rates...
EngageNY
Some Facts About Graphs of Linear Equations in Two Variables
Develop another way to find the equation of a line. The lesson introduces the procedure to find the equation of a line given two points on the line. Pupils determine the two points from the graph of the line.
EngageNY
Every Line is a Graph of a Linear Equation
Challenge the class to determine the equation of a line. The 21st part in a 33-part series begins with a proof that every line is a graph of a linear equation. Pupils use that information to find the slope-intercept form of the equation...
EngageNY
The Graph of a Linear Equation in Two Variables Is a Line
Show your class that linear equations produce graphs of lines. The 20th segment in a unit of 33 provides proof that the graph of a two-variable linear equation is a line. Scholars graph linear equations using two points, either from...
Balanced Assessment
Dollar Line
Challenge the class to develop a story that matches a graph. The short assessment provides a line graph with the vertical axis labeled as dollars. The task asks pupils to develop a description of a situation that could be represented by...
EngageNY
Comparing Linear Functions and Graphs
How can you compare linear functions? The seventh installment of a 12-part module teaches learners how to compare linear functions whose representations are given in different ways. They use real-world functions and interpret features in...
EngageNY
Graphs of Functions and Equations
Explore the graphs of functions and equations with a resource that teaches scholars how to graph functions as a set of input-output points. They learn how the graph of a function is the graph of its associated equation.
Balanced Assessment
Red Dots, Blue Dots
Count the connections between dots. Young mathematicians come up with a method to determine the number of connections between pairs of dots. The assessment leads the class to determine the connections they can make when groups are...
Worksheet Web
Using Pictographs
If one ice cream cone represents three ice cream scoops, and Bob has four ice cream cones, then how many scoops does Bob have? Learners solve these kind of questions with their new understanding of pictographs.
Inside Mathematics
Coffee
There are many ways to correlate coffee to life, but in this case a worksheet looks at the price of two different sizes of coffee. It requires interpreting a graph with two unknown variables, in this case the price, and solving for those...
Balanced Assessment
Multi-Graphs
So many things change as time goes by. Here, scholars create graphs based on this premise. Each problem asks pupils to sketch a graph that describes a given situation. Their graphs represent various characteristics such as height,...
Balanced Assessment
Time Line
Use a graph to tell a story! Given a graph, young scientists create a story to match. They must provide their own axes labels and description of the scenario. The graph has increasing, decreasing, and constant sections.


