Khan Academy
Khan Academy: Read Histograms
Practice reading and interpreting histograms. Students receive immediate feedback and have the opportunity to try questions repeatedly, watch a video or receive hints.
CK-12 Foundation
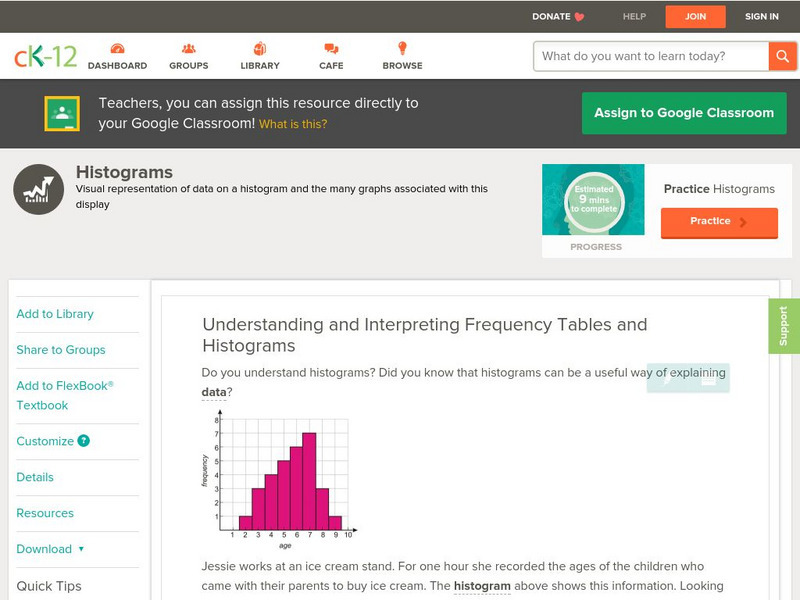
Ck 12: Statistics: Histograms Grade 8
[Free Registration/Login may be required to access all resource tools.] Students will interpret frequency tables and connect data to histograms.
Houghton Mifflin Harcourt
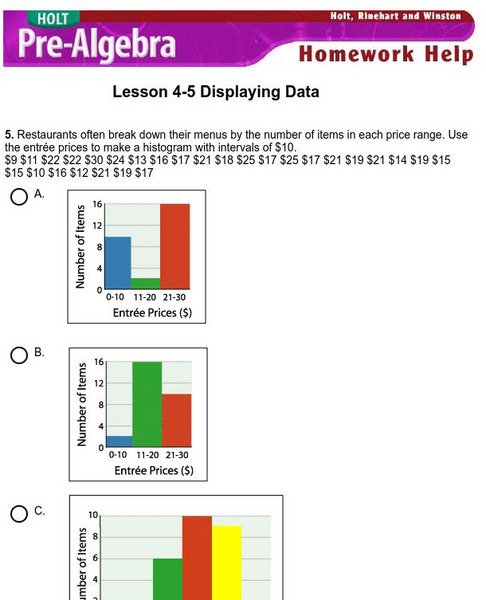
Holt, Rinehart and Winston: Homework Help Independent Practice: Displaying Data
Get independent practice displaying data. Each incorrect response gets a text box explanation and another try. Correct responses are confirmed.
Texas Instruments
Texas Instruments: Glencoe: Graphing Calculator Investigation Histogram
Students will make histograms, find the frequency of each interval and explore the domain.
University of Georgia
University of Georgia: Inter Math: Histogram
This site provides details about histograms. The site contains a link on the step by step procedure of creating a histogram. There are links to related terms, everyday examples, challenging problems, more information, and the interactive...
Illustrative Mathematics
Illustrative Mathematics: Understanding the Standard Deviation
The purpose of this task is to deepen student understanding of the standard deviation as a measure of variability in data distribution. The task is divided into four parts, each of which asks students to think about standard deviation in...
CK-12 Foundation
Ck 12: Statistics: Applications of Histograms
[Free Registration/Login may be required to access all resource tools.] Use calculators to create graphical representations of data, such as histograms.
CK-12 Foundation
Ck 12: Statistics: Histograms Grades 9 10
[Free Registration/Login may be required to access all resource tools.] Make a histogram given a frequency table.
McGraw Hill
Glencoe Mathematics: Online Study Tools: Histograms
This site gives a short interactive quiz which allows students to self-assess their understanding of the concept of histograms.
Alabama Learning Exchange
Alex: Misleading Graphs Are Da'pits!
In this interactive lesson, students will discover how creating an incorrect graph will display misleading information. Through viewing and discussing a variety of graphs, the students will identify 5 components that graphs must contain...
Better Lesson
Better Lesson: Hilarious Histograms. Analyzing and Creating
The students will be using real life data to create and analyze histograms. They will be surveying their classmates and using data from other grade levels to compare same topic information in a histogram.
Better Lesson
Better Lesson: Histogram Activity
Sixth graders will see how an actuary uses histograms to analyze the frequency of events to determine risk.
National Council of Teachers of Mathematics
Nctm: Illuminations: Advanced Data Grapher
The Advanced Data Grapher can be used to analyze data with box plots, bubble graphs, scatterplots, histograms, and stem-and-leaf plots.
National Council of Teachers of Mathematics
Nctm: Illuminations: Histogram Tool
This tool can be used to create a histogram for analyzing the distribution of a data set using data that you enter or using pre-loaded data that you select.
National Council of Teachers of Mathematics
Nctm: Illuminations: State Names
Students use multiple representations to display how many times the letters of the alphabet is used in a state name. Concepts explored: stem and leaf, box and whisker plots, histograms.
Better Lesson
Better Lesson: Welcome to 6th Grade Math
Why is math important? How does math impact our lives outside of math class? This instructional activity is an introduction to 6th-grade math. Students make connections between math and life while also learning procedures and rules in...
Quia
Ixl Learning: Histograms
Brush up on your math skills relating to histograms then try some practice problems to test your understanding.
Khan Academy
Khan Academy: Histograms Review
A histogram displays numerical data by grouping data into "bins" of equal width. Each bin is plotted as a bar whose height corresponds to how many data points are in that bin.
Other
Nearpod: Introduction to Data Representation
In this lesson on representation data, students explore how to make dot plots, histograms, and box plots and learn about outliers in a data set.
Other
Grinnell College: Histograms Area of Rectangles
A sample problem is provided to help you create a histogram using a frequency distribution chart. Sample charts and formulas are provided to help explain how to find the area of the rectangles in the histogram and how to interpret what...
Stefan Warner and Steven R. Costenoble
Finite Mathematics & Applied Calculus: Histogram and Probability Distribution Generator
The learning tool displays data in the form of a histogram. The tool also shows descriptive statistics and probability distributions. Examples of data are included.
ClassFlow
Class Flow: Graphs
[Free Registration/Login Required] This flipchart presents bar and double bar graphs, line and double line graphs, pictographs, histograms, and circle graphs with review activities and web links for practice.
ClassFlow
Class Flow: Histograms Handling Data
[Free Registration/Login Required] In this Flipchart, students are introduced to the interpreting and creating histograms, finding the frequency density, and then graphing the results.
Shmoop University
Shmoop: Basic Statistics and Probability: Histograms
Students learn about histograms. Examples are included, as well as a video. [1:16]


