Mathalicious
Domino Effect
Carryout the instructional activity to determine the cost of pizza toppings from a Domino's Pizza® website while creating a linear model. Learners look through real data—and even create their own pizza—to determine the cost of each...
Rice University
College Algebra
Is there more to college algebra than this? Even though the eBook is designed for a college algebra course, there are several topics that align to Algebra II or Pre-calculus courses. Topics begin with linear equation and inequalities,...
CCSS Math Activities
Smarter Balanced Sample Items: 8th Grade Math – Target J
Look at patterns in bivariate data. Eight sample items illustrate the eighth grade statistics and probability standards. The Smarter Balanced Sample multiple-choice items focus on numerical and categorical bivariate data. The slide show...
Concord Consortium
Function Project
What if a coordinate plane becomes a slope-intercept plane? What does the graph of a linear function look like? Learners explore these questions by graphing the y-intercept of a linear equation as a function of its slope. The result is a...
5280 Math
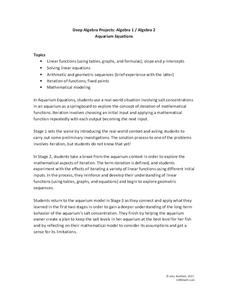
Aquarium Equations
Take a look at linear functions in a new environment. A three-stage algebra project first asks learners to model the salt concentration of an aquarium using linear functions. Then, using iterations, pupils create a set of input-output...
101 Questions
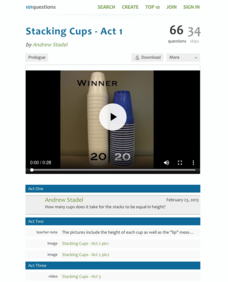
Stacking Cups
Facilitate an understanding of equality using a modeling task. After watching different-sized cups being stacked, learners use their math skills to determine when the height of each cup tower will be the same. Meant as an introduction to...
101 Questions
25 Billion Apps
Learn to use mathematics to your advantage! Using linear modeling, scholars predict the date and time the Apple App Store reaches 25 billion downloads. Considering the prize for the 25 billionth download was a $10,000 gift card, modeling...
Concord Consortium
All-in-All Problems
Graphs, functions, symbols, and more! Use these strategies to model everything from the flow of a river to the number of cars passing a toll booth. Presented differently but solved similarly, learners consider five different scenarios...
Mascil Project
Container Logistics
Here's a creative lesson that lets pupils be creative as well! While considering many different factors, learners devise a plan to increase the efficiency of container shipments. The design of the activity encourages creative,...
Kenan Fellows
How Does an Unhealthy Diet Influence our Health and Well-Being?
You are what you eat, or so they say! After surveying family and friends on a week of eating habits, learners analyze the data for patterns. They compare different variables such as fats and cost, fats and calories, or fats and LDLs.
101 Questions
Snow Day
Who doesn't like a snow day? Learners watch a snow accumulation over a span of 10 hours. They use that information to make a prediction of the total snow that fell during the 23-hour snowfall. Will it be enough to cancel school?
Howard County Schools
To Babysit or Not to Babysit?
Would you work for a penny today? Use this activity to highlight the pattern of increase in an exponential function. Scholars compare two options of being paid: one linear and one exponential. Depending on the number of days worked, they...
101 Questions
Deodorant
Smells like learning! Young scholars collect data on the length of time a stick of deodorant lasts. After modeling the data with a graph and function, they make predictions about deodorant use over time.
101 Questions
What Micheal’s Coupon Should You Use?
Get your classes on their way to extreme couponing! Young mathematicians analyze two different coupon options for the better deal. They use different scenarios to predict and compare the outcomes.
101 Questions
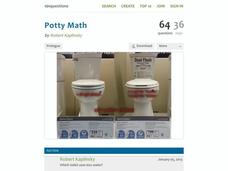
Potty Math
You don't want to flush your money down the drain! Have your classes complete a financial comparison between two different types of toilets. They use linear modeling to determine the most cost-effective model.
101 Questions
Coins in a Circle
Round and round you'll go! Learners watch as different-sized circles fill with coins. They collect data and then make a prediction about the number of coins that will fit in a large circular rug.
101 Questions
Bottomless Mug
How much coffee can you actually drink? An intriguing lesson has learners consider an advertisement for a bottomless mug of coffee. While considering the price of the mug, they analyze different scenarios to determine the cost-saving...
101 Questions
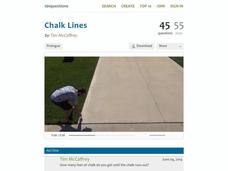
Chalk Lines
Read between the lines to find a solution. Budding mathematicians analyze a situation to solve a problem. They view a video presentation of the problem, brainstorm important information to gather, and write linear equations to find...
101 Questions
How Many Hot Dogs?
Top off your hot dogs with a little math. Learners view a video on a hot dog eating contest, and then answer questions using estimation. Using a table of hypothetical data, they create algebraic expressions to represent the situation.
CK-12 Foundation
Applications Using Linear Models: Scuba Diving
Dive into this resource on rates of change and linear models. Pupils use two sliders in an interactive to adjust water temperature and depth. They use a given linear equation to calculate the rate of change in water temperature per unit...
CK-12 Foundation
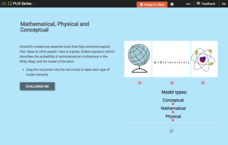
Modeling: Mathematical, Physical and Conceptual
Scientific models help explain ideas and concepts to non-experts. The online activity covers conceptual, mathematical, and physical models. Through four multiple-choice questions and three discussion questions, scholars gain a deeper...
National Council of Teachers of Mathematics
Geogebra: Residuals and Linear Regression
If the line fits, use it. Using a Geogebra interactive, pupils plot points and try to find the best fit line. They assess the linear fit by analyzing residuals. A radio button allows participants to show the regression line and the...
California Education Partners
Linflower Seeds
How does your garden grow? Use proportions to help Tim answer that question. By using their understanding of proportional relationships, pupils determine the number of seeds that will sprout. They create their own linear...
Mathematics Vision Project
Modeling Data
Is there a better way to display data to analyze it? Pupils represent data in a variety of ways using number lines, coordinate graphs, and tables. They determine that certain displays work with different types of data and use...


