Curated OER
Graphing Stories Ice Breaker
Kick off the school year with some math fun! New classmates share information about themselves by using graphs and interpreting data. The goal is to use a general graph shape, such as linear or exponential, and create labels for the axes...
Curated OER
Pizza Fractions
Everyone loves pizza! Learners define fractions and use manipulatives to calculate fractions. Kids cut circles to represent various fractional parts of a pizza. Some accommodations are included.
Curated OER
Smiling at Two Digit Multiplication!
How do I solve a two-digit multiplication problem? Your class tackles this question by walking through problem solving methods. They first investigates and applies traditional multiplication methods, and they then compare those with...
Curated OER
Initial Fraction Ideas Lesson 10: Overview
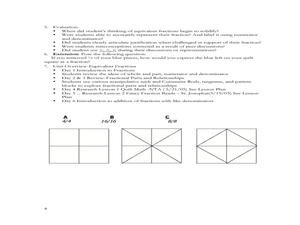
Third graders use strips of paper to find equivalent fractions. They will fold paper into thirds and shade 2/3 of the paper. Then fold the same paper in six parts and predict how many parts will be shaded. They will repeat again folding...
Curated OER
Half Math Quilt
Help your third graders become familiar with equivalent fractions for one-half by having them create a quilt. They will use triangles to create a quilt of equivalent fractions over a period of 6 days. As they create the quilt pieces they...
Beyond Benign
Scale the Wall
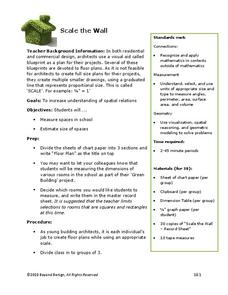
How can you fit an entire school on one sheet of paper? You use scale! Scholars measure rooms in the school and, using the correct scale, design a floor plan that includes area calculations with their data.
K20 LEARN
Ace in the Hole
How does inertia affect an object's trajectory? After watching a video on safety belt use, pupils discuss the notions of inertia. Using their knowledge, individuals try to drop a ball on a target while running, and classmates observe the...
K20 LEARN
Round and Round We Go
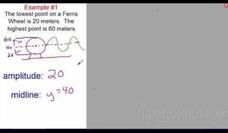
Connect the dots on trigonometry with K'nex. Scholars use a K'nex model of a Ferris wheel to collect data points to plot on a height versus time graph. They'll then consider what type of function best models the data in the graph—and...
American Statistical Association
Nonlinear Modeling: Something Fishy
There are plenty of fish in the sea, but only a few good resources on regression. Young mathematicians first perform a linear regression analysis on provided weight and length data for fish. After determining that a linear model is not...
Flipped Math
Modeling with Trig Functions
Find out what to do with Ferris wheels that keep going up and down. Individuals learn how to determine the frequency of a trigonometric function. Pupils use their knowledge of trigonometric functions to model periodic motions like Ferris...
Flipped Math
Unit 7 Review: Exponential Functions
Take a break from learning new information and take time to review. Scholars review the unit by completing some practice problems. They rewrite expressions using exponents, solve exponential equations, graph exponential functions,...
Flipped Math
Calculus AB/BC - Unit 7 Review: Differential Equations
Differentiate everyone's knowledge. Pupils work through nine review questions to highlight key concepts from Unit 7. Items range from finding slope fields and reasoning with them to finding general and particular solutions of...
Flipped Math
Calculus AB/BC - Modeling Situations with Differential Equations
Differentiate between models. Pupils watch as the video works through three examples of creating a differential equation to model a situation. Scholars use their knowledge of proportional relationships to set up the equations and to...
Flipped Math
Unit 10 Review: Quadratics
Everything one wanted to know about parabolas in one place. Pupils work 27 problems as a review of the unit on quadratics. Problems range from determining key features of the function and using that information to graph the parabola, to...
Flipped Math
Modeling with Quadratics
Do some interpretive modeling. Class members watch three examples of interpreting key features of a graph of a quadratic to find solutions to a real-world problem. Learners review how to find the key features on a graph using technology...
Flipped Math
Unit 1 Review: Analyze Graphs and Expressions
Get in one last practice. Pupils work through 12 problems and a performance task to review the topics in Unit 1. The problems cover analyzing and modeling with graphs, algebraic properties of equality, and adding, subtracting, and...
Flipped Math
Modeling with Graphs
Create a graph for anything in the world. Pupils continue to work with graphs that model situations. The learners analyze different graphs to answer questions about the scenario along with finding equations of graphs. Scholars use...
Flipped Math
Calculus AB/BC - Solving Optimization Problems
Move beyond setting up equations. Pupils continue with optimization problems and use their knowledge of derivatives to find solutions. They watch as the video uses equations from previous examples and find solutions to answer specific...
Flipped Math
Calculus AB/BC - Introduction to Optimization Problems
Let's get the equation set. Pupils see the importance of setting up an one-variable equation in the first of two lessons on optimization problems. The presenter works four different types of problems before individuals use the included...
National Institute of Environmental Health Sciences
Lesson 2: Using the Pandemic Vulnerability Index Model to Examine the Risk Factors Associated with COVID-19
A lesson asks young mathematicians to investigate the social determinants and the environmental factors that influence risk factors associated with the spread of COVID-19. Class members then brainstorm what they can do to alleviate the...
National Institute of Environmental Health Sciences
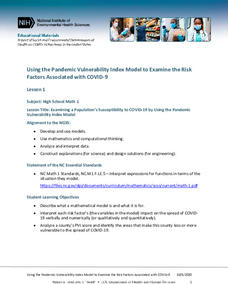
Lesson 1: Using the Pandemic Vulnerability Index Model to Examine the Risk Factors Associated with COVID-19
How vulnerable are you to COVID-19? High school mathematicians use the Pandemic Vulnerability Index to create models that help them collect and analyze data about the risk factors associated with COVID-19. After investigating four groups...
Radford University
Data Driven
Use the data for a good cause. Groups first analyze provided data and decide which function type would best model the situation. They then investigate a problem relevant to their lives by collecting data and analyzing the results using...
Radford University
Modeling the Number of Starbucks Stores
Drink your coffee, then marvel over the rise of Starbucks. Scholars use provided data on the number of Starbucks stores from 1987 through 2014 to create scatter plots. They then determine the equation for the curve that best fits the...
Radford University
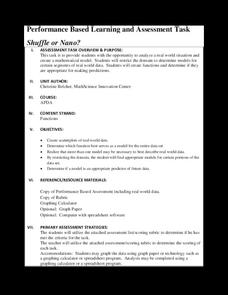
Shuffle or Nano?
Mix up your teaching playlist with a performance-based assessment task. Given iPod sales data for several years, scholars create a scatter plot and perform regression analysis. They determine the best fit curve for different domains.


