Texas Education Agency
Texas Gateway: Collecting Data and Making Predictions
Given an experimental situation, the student will write linear functions that provide a reasonable fit to data to estimate the solutions and make predictions.
Texas Education Agency
Texas Gateway:analyzing Effects of the Changes in M and B on the Graph of Y=mx+b
Given algebraic, graphical, or verbal representations of linear functions, the studnet will determine the effects on the graph of the parent function f(x) = x.
Stefan Warner and Steven R. Costenoble
Finite Mathematics & Applied Calculus: Linear Functions and Models: Basics: Slope and Intercept
A mathematics tutorial that allows you to interactively learn and manipulate the slope and intercepts of a line.
Shodor Education Foundation
Shodor Interactivate: Functional Graphs
Students will graph input/output pairs from a simple linear function in order to gain an understanding of basic linear functions.
Cuemath
Cuemath: Constant Functions
This mini-lesson targets the concept of constant functions. Provides a definition, shows graphs, and defines their characteristics along with some solved examples and a few practice questions to test your understanding.
Concord Consortium
Seeing Math: Linear Transformer
Transformations of linear functions, with links between the symbolic and graphic forms, can be powerful tools to help students overcome conceptual hurdles in algebra.
Shodor Education Foundation
Shodor Interactivate: Whole Number Cruncher
Put a number, the input, in the Whole Number Cruncher. See if you can discover the rule that gives you the result, the output. Directions are just a click away.
Shodor Education Foundation
Shodor Interactivate: Positive Linear Function Machine
The interactive activity has students explore positive linear functions by looking for patterns in the outputs to determine the function. The activity and teacher resources are included.
Texas Instruments
Texas Instruments: Stay Tuned: Sound Waveform Models
In this activity, students' will record the sound waveform of a tuning fork and analyze the waveform to determine frequency, period and amplitude information. They will model the waveform using trigonometric functions.
Texas Instruments
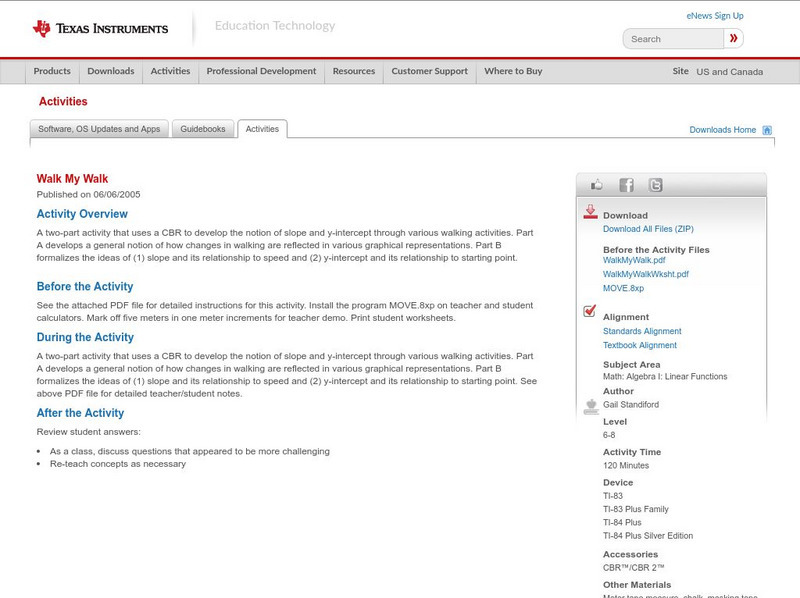
Texas Instruments: Walk My Walk
A two-part activity that uses a CBR to develop the notion of slope and y-intercept through various walking activities. Part A develops a general notion of how changes in walking are reflected in various graphical representations. Part B...
Texas Instruments
Texas Instruments: Synonyms and Function Fictionary Using Ti Navigator
This activity will help students make sense of the idea of equivalence in Algebra. This is a fundamental concept behind simplifying expressions, a core topic in the curriculum. The graphical representation of a function can anchor...
Texas Instruments
Texas Instruments: The Family of Linear Functions
Students can use a graphing calculator to explore families of linear functions. This Technology Lab accompanies Lesson 5-9 from the 2007 Holt, Rinehart and Winston textbook.
Texas Instruments
Texas Instruments: A Sweet Drink Adventure 7
Students determine how the temperature of water affects the dissolving time of a sugar cube. They create, interpret and analyze graphs of data, find an equation of the line of best fit, and relate slope to rate of change.
Texas Instruments
Texas Instruments: Graphing Your Motion With Easy Data App and Cbr 2
Students can use a CBR 2 motion detector to measure distance and velocity. Students prepare graphs of motion and analyze them. They compare and match graphs of distance versus time and velocity versus time.
Texas Instruments
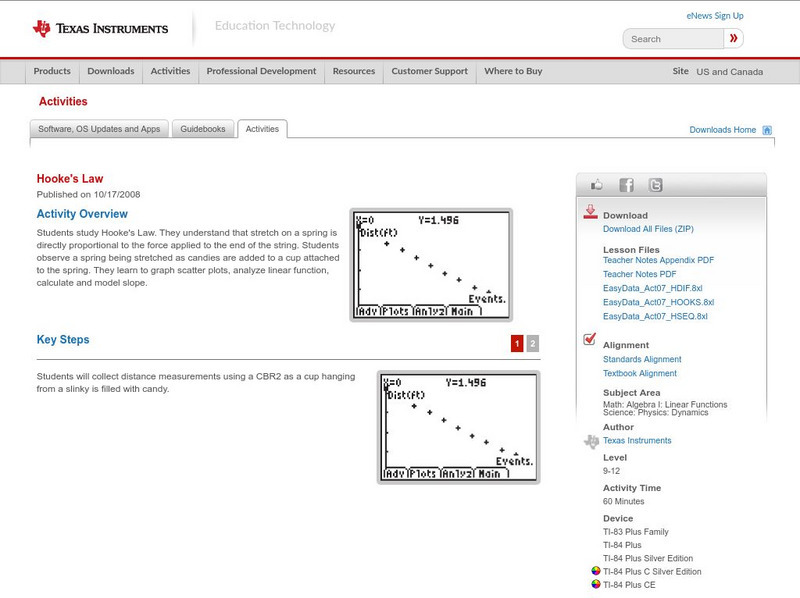
Texas Instruments: Hooke's Law
In this activity, students study Hooke's Law. They understand that stretch on a spring is directly proportional to the force applied to the end of the string. Students observe a spring being stretched as candies are added to a cup...
Texas Instruments
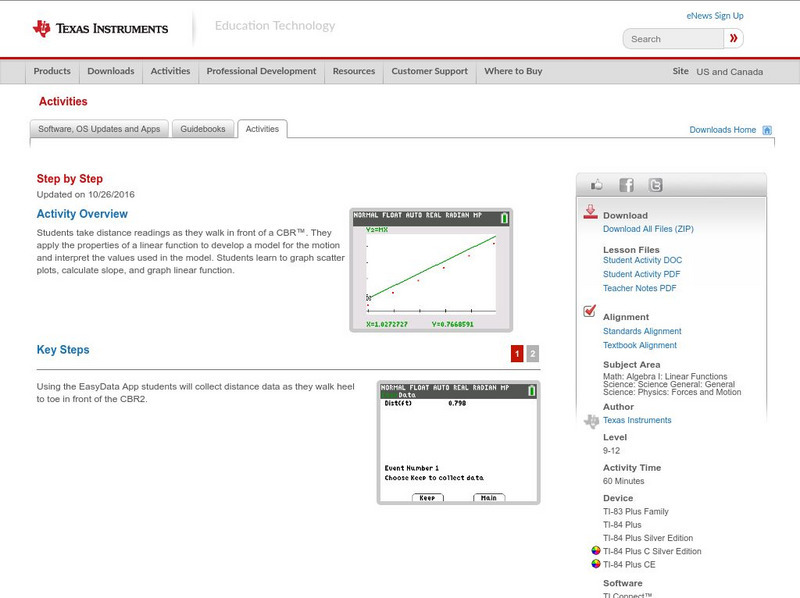
Texas Instruments: Step by Step
In this activity, students take distance readings as they walk in front of a CBR. They apply the properties of a linear function to develop a model for the motion and interpret the values used in the model. Students learn to graph...
Texas Instruments
Texas Instruments: Chill Out: How Hot Objects Cool
Students use a temperature probe to collect data as the warmed probe cools. Students investigate Newton's law of cooling and model cooling data with an exponential function. They fit the data to a mathematical model after analysis.
Texas Instruments
Texas Instruments: Linear Pictures in the Activity Center
Students can use their knowledge of linear functions to match real world linear situations. Students will be asked to match equations to linear pictures that are imposed in a coordinate plane.
Texas Instruments
Texas Instruments: A Day at the Beach Adventure 9
Students compare the heating rates of wet sand and dry sand and study the effect of evaporation on heating rates. They create, interpret and analyze graphs of data. They also relate slope to rate of change.
Texas Instruments
Texas Instruments: Ti 73 and Cbl in Data Collection
Using the TI 73 and CBL to collect samples of water for temp, pH, etc connecting math and science curriculums in the middle school.
Texas Instruments
Texas Instruments: Swinging Ellipses: Plotting an Ellipse
In this activity, Students can use a motion detector to record the position and velocity of a swinging pendulum. They will plot the data as a velocity versus position phase plot and determine an ellipse that fits it.
Texas Instruments
Texas Instruments: The Linear Force Relation for a Rubber Band
In this activity, students' will use a force sensor and a motion detector to study the relationship between the force applied to a rubber band and the distance to which it stretches. They will then model force versus strech data with a...
Texas Instruments
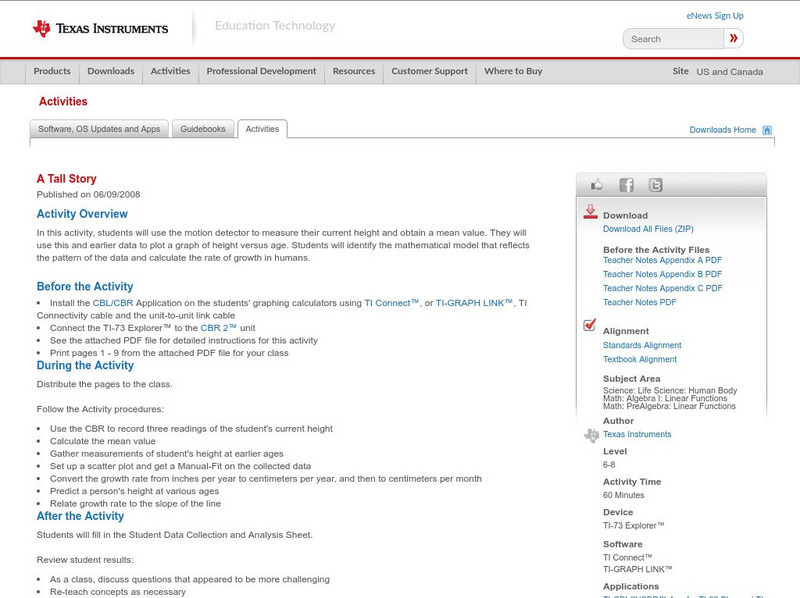
Texas Instruments: A Tall Story
In this activity, students can use the motion detector to measure their current height and obtain a mean value. They will use this and earlier data to plot a graph of height versus age. Students will identify the mathematical model that...
Texas Instruments
Texas Instruments: Where Should They Hold the Fundraising Party?
Students learn how to create a table of values for a simple linear function and use the table to create a graph on squared paper. They use the graphing calculator to display the ordered pairs and find values of corresponding to values of...


