CK-12 Foundation
Graphs in the Coordinate Plane: Functions on a Cartesian Plane
Connect the dots to graph a linear function. Young mathematicians use an interactive to first plot provided points on a coordinate plane. They connect these points with a line and then answer questions about the slope and y-intercept of...
Education Development Center
Creating a Polynomial Function to Fit a Table
Discover relationships between linear and nonlinear functions. Initially, a set of data seems linear, but upon further exploration, pupils realize the data can model an infinite number of functions. Scholars use multiple representations...
CK-12 Foundation
Determining the Equation of a Line: Trip Functions
Let the function drive the activity. The interactive displays the odometer on a car for a trip. Pupils determine and interpret the slope of the situation. Then, they find a verbal description of the equation of the function.
CK-12 Foundation
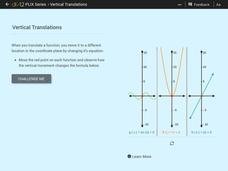
Vertical Translations
Change the y-intercept by adding a constant to the function. Individuals move three functions vertically along the y-axis. As they observe how the equation of the functions change with the vertical movement, learners determine how...
Mathematics Vision Project
Connecting Algebra and Geometry
Connect algebra and geometry on the coordinate plane. The eighth unit in a nine-part integrated course has pupils develop the distance formula from the Pythagorean Theorem. Scholars prove geometric theorems using coordinates...
Mathematics Vision Project
Features of Functions
What are some basic features of functions? By looking at functions in graphs, tables, and equations, pupils compare them and find similarities and differences in general features. They use attributes such as intervals of...
Mathematics Vision Project
Linear and Exponential Functions
Provide a continuous progression to linear and exponential functions. Pupils continue to work with the discrete functions known as sequences to the broader linear and exponential functions. The second unit in a series of nine provides...
CK-12 Foundation
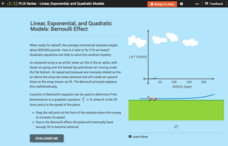
Linear, Exponential, and Quadratic Models: Bernoulli Effect
How can an object as heavy as an airplane fly? Turns out the answer is quadratic! Your classes explore the Bernoulli Effect through an interactive graph representation. As a plane increases in speed, the lift force also increases. Young...
PBL Pathways
College Costs
Predict the year that college costs will double in your state using linear modeling. The first part of this two-part project based learning activity asks young mathematicians to use data from the College Board. They graph the data,...
PBL Pathways
Medical Insurance 3
Create a technical report explaining the components of a medical plan through a function. The project-based learning activity gives a medical insurance scenario that young mathematicians model using piecewise functions. Their analyses...
PBL Pathways
Medical Insurance 2
Make an informed decision when choosing a medical insurance provider. An engaging lesson asks your classes to write piecewise models to represent the cost of different medical plans. The project-based learning activity is a variation of...
PBL Pathways
Medical Insurance
Design a plan for finding the best health insurance for your money. Learners compare two health plans by writing and graphing piecewise functions representing the plan rules. Using Excel software, they create a technical report...
PBL Pathways
Do Homework?
To complete homework or not to complete homework ... that is the question. Decide whether it makes a difference on finals by doing homework. Individuals create a scatter plot and find a line of best fit for data on the percent of...
Virginia Department of Education
Linear Modeling
An inquiry-based algebra lesson plan explores real-world applications of linear functions. Scholars investigate four different situations that can be modeled by linear functions, identifying the rate of change, as well as the...
Virginia Department of Education
Functions: Domain, Range, End Behavior, Increasing or Decreasing
Examine key features of various functions through exploration. A comprehensive instructional activity has learners describe the domain, range, end behavior and increasing/decreasing intervals of various functions. Function types include...
Intel
Choreographing Math
Leaners investigate families of linear functions through dance. They choreograph dance moves to model nine unique linear functions of their choosing. Using their dance moves, teams create a video presentation complete with music and...
West Contra Costa Unified School District
Point-Slope Application Problems
Create a linear equation for a problem when the intercept information is not given. The two-day lesson introduces the class to the point-slope form, which can be used for problems when the initial conditions are not provided. Pupils...
Illustrative Mathematics
Temperature in Degrees Fahrenheit and Celsius
Scholars develop the conversion formulas between Fahrenheit and Celsius with a task that presents the class with two known temperature equivalents between the two scales. Pupils use those two points to develop the linear conversion...
Virginia Department of Education
Functions 2
Demonstrate linear and quadratic functions through contextual modeling. Young mathematicians explore both types of functions by analyzing their key features. They then relate these key features to the contextual relationship the function...
Virginia Department of Education
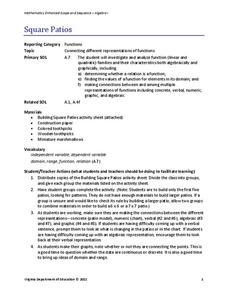
Square Patios
Build a patio from toothpicks and marshmallows to analyze functions! Learners look for patterns in the data as they create different size patios. As they discover patterns, they make connections between the different representations of...
Mathematics Common Core Toolbox
Golf Balls in Water
Here's a resource that models rising water levels with a linear function. The task contains three parts about the level of water in a cylinder in relationship to the number of golf balls placed in it. Class members analyze the data and...
Illustrative Mathematics
Households
Use an inverse linear function to interpolate a point. Presented with the number of households over a period of year, pupils find a linear function that will be a model. Class members determine the inverse of the linear function and use...
EngageNY
Linear Equations in Two Variables
Create tables of solutions of linear equations. A lesson has pupils determine solutions for two-variable equations using tables. The class members graph the points on a coordinate graph.
EngageNY
End-of-Module Assessment Task: Grade 8 Module 6
Test your knowledge of linear functions and models. The last installment of a 16-part module is an end-of-module assessment task. Pupils solve multi-part problems on bivariate data based on real-world situations to review concepts from...


