EngageNY
Sampling Variability in the Sample Mean (part 1)
How accurate is data collected from a sample? Learners answer this question using a simulation to model data collected from a sample population. They analyze the data to understand the variability in the results.
Mathematics Assessment Project
100 People
It's a small world after all. In the middle school assessment task, learners use data that imagines there are only 100 people in the world to answer questions about population demographics. Young mathematicians use ratio and proportional...
Regents Prep
Activity to Show Sample Population and Bias
There is bias in many aspects of our lives, and math is no exception! Learners explore provided data to understand the meaning of biased and random samples. The resource includes various data sets from the same population, and...
It's About Time
Factors Affecting Population Size
How do we predict future population growth? Young researchers investigate various factors affecting the size of our population. As they calculate and interpret graphs to determine factors that could potentially affect increases...
Curated OER
Human Population- Changes in Survival Rates Data Interpretation
For this human population changes in survival worksheet, students interpret and plot data to understand the differences in human mortality and survivorship between historic and modern times. They investigate how these changes influence...
Curated OER
Graphs and Data
Young scholars investigate poverty using graphs. In this algebra lesson, students collect data on the effects of poverty and use different rules to analyze the data. They graph and use the trapezoid rule to interpret the data.
Curated OER
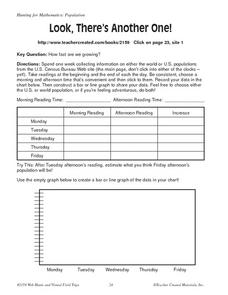
Look, There's Another One!
In this math worksheet, students spend a week collecting information on either the word or U.S. populations from the U.S. Census Bureau Web site. Students record their data in a chart and bar graph. Students also use the website to...
Curated OER
Where Should We Put a Store?
Students analyze population data. They convert population data into simple density maps to help make decisions about their world. They select the best location for a school store based on population density. They present their maps...
Curated OER
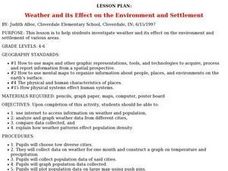
Weather and its Effect on the Environment and Settlement
Students, after choosing two diverse cities, collect data on weather for a month and construct a graph on temperature and precipitation. After collecting population data of said cities, and graphing it, they plot population on a large...
Other
Forbes: Migration Map
Enter a county or major city to see the inbound and outbound migration data. This map visualizes migration data from the years 2005-2010 that the IRS has collected. In order to preserve privacy, the IRS only includes moves that more than...
Columbia University
Nasa: Sedac: Population, Landscape, and Climate Estimates
[Free Registration/Login Required] A huge resource for researchers without GIS capabilities who need data on population and land area by country across a range of physical characteristics. These include measures such as the number of...
US Census Bureau
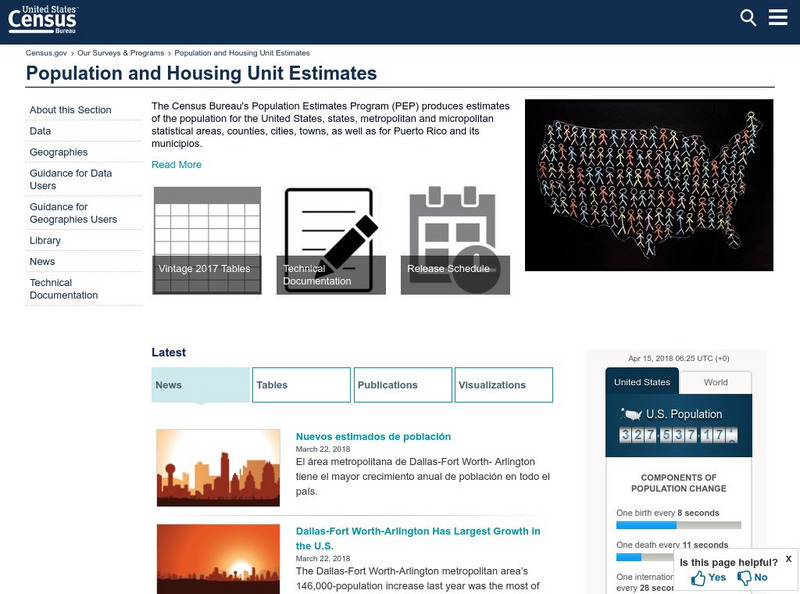
U.s. Census: Population
This site is great for gathering sociological data. Data can be related to a wide variety of topics. Great for research!
The World Bank
World Bank: Poulation, Total
This site from the World Bank provides data on population for most of the countries of the world in 2020, and shows the change in the rate from 1960 to 2020. Statistics are presented in a chart, line graph, bar graph, and map. The data...
Texas Instruments
Texas Instruments: Math Today More of Us
In this activity students will investigate exponential functions and their graphs using real-life data. Students will analyze population data for the United States and create an exponential model for the scatter plot.
Texas Instruments
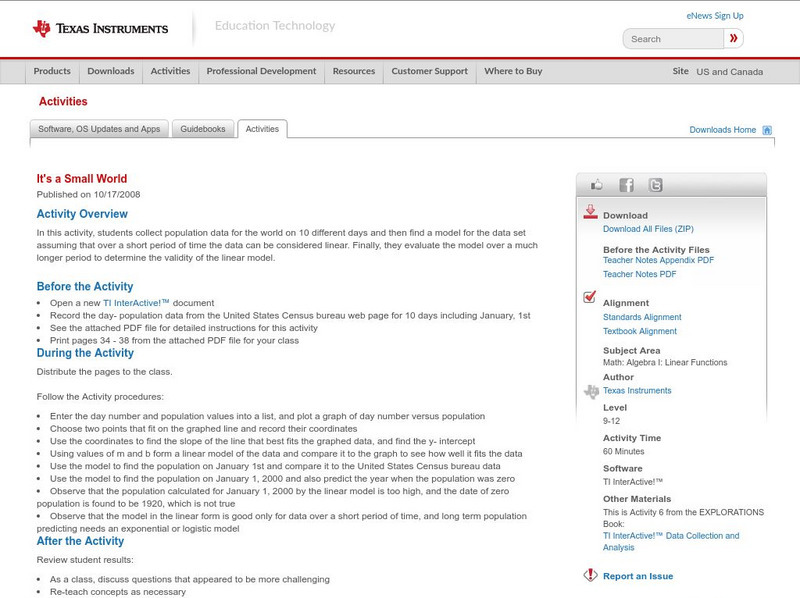
Texas Instruments: It's a Small World
In this activity, students collect population data for the world on 10 different days and then find a model for the data set assuming that over a short period of time the data can be considered linear. Finally, they evaluate the model...
Other
Census of India
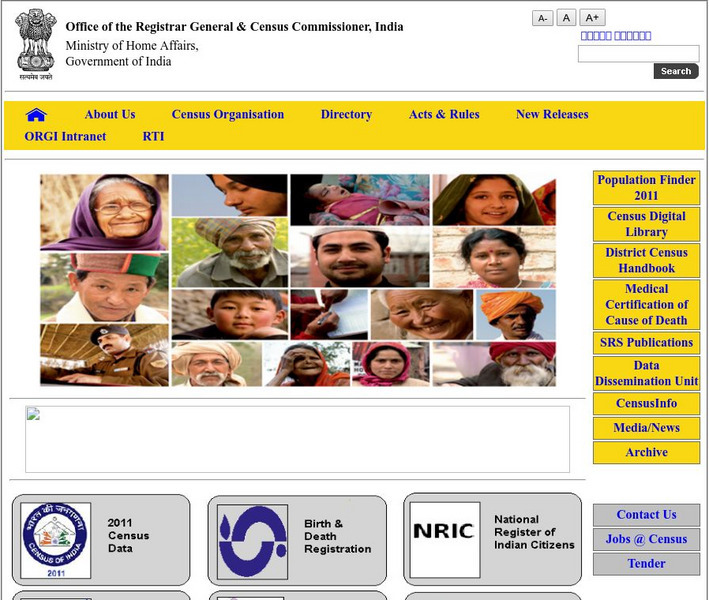
The Indian Census is the largest single source of statistics on the people of India. This is the official site that includes a wealth of statistics.
Central Intelligence Agency
Cia: World Fact Book: Homepage
Sponsored by the CIA, the World Fact Book gives current information about the world's countries and peoples. Includes geography, people, government, economy, communications, transportation, military, and transnational issues sections.
Illustrative Mathematics
Illustrative Mathematics: F Le Choosing an Appropriate Growth Model
The goal of this task is to examine some population data for large cities from a modeling perspective. Students are asked to decide if the population data can be accurately modeled by a linear, quadratic, and/or exponential function, and...
Illustrative Mathematics
Illustrative Mathematics: F Le Us Population 1982 1988
In this task, students are shown a table of U.S. population data between 1982 and 1988 and are asked to explore whether linear functions would be appropriate to model relationships within the data. Aligns with F-LE.B.5 and F-LE.A.1.b.
Illustrative Mathematics
Illustrative Mathematics: F Le in the Billions and Linear Modeling
In this task, students are shown a table of world population data and asked to explore whether linear functions would be appropriate to model relationships within the data. Aligns with F-LE.A.1.b.
CK-12 Foundation
Ck 12: Biology: Population Growth
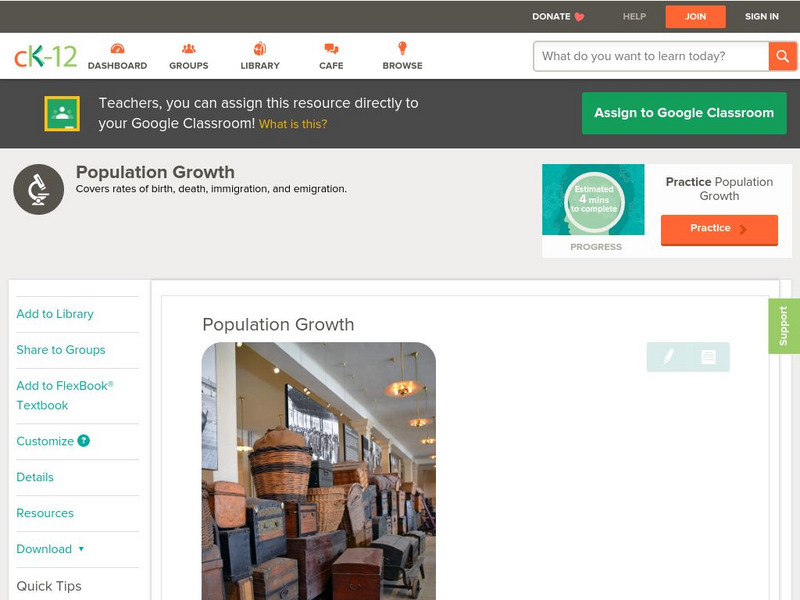
[Free Registration/Login may be required to access all resource tools.] Describes how rates of birth, death, immigration, and emigration affect population growth.
Population Connection
Population Connection: 7 Billion
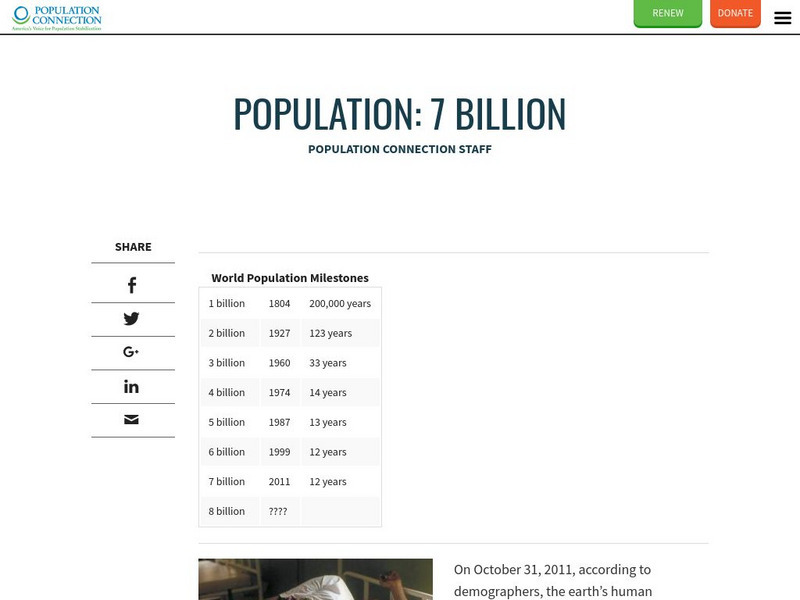
This fact sheet from the non-profit organization Population Connection addresses the problem of overpopulation as the Earth approaches 7 billion residents. Includes statistics and details the reasons why many experts are concerned about...
CK-12 Foundation
Ck 12: Algebra Ii: 5.7 Margin of Error
This section introduces the concept of Margin of Error. Explore how results from surveys are most accurate within a range of values, and use this concept to make inferences about the preferences of a full population, given data from a...
CK-12 Foundation
Ck 12: Algebra Ii: 5.4 Standard Deviation
Explore what the standard deviation is as it relates to the graph of a normal distribution curve.


