EngageNY
Counting Rules—The Fundamental Counting Principle and Permutations
Count the benefits of using the resource. The second installment of a 21-part module focuses on the fundamental counting principle to determine the number of outcomes in a sample space. It formalizes concepts of permutations and...
Bowland
Explorers – Patrol Services
Far out — plan a trip to space! Aspiring mathematicians steer a space vehicle through an asteroid field, calculate currency exchanges to buy provisions, and determine placement of charges to blow up asteroids. Along the way, they learn...
Statistics Education Web
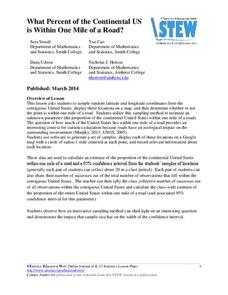
What Percent of the Continental US is Within One Mile of a Road?
There are places in the US where a road cannot be found for miles! The lesson asks learners to use random longitude and latitude coordinates within the US to collect data. They then determine the sample proportion and confidence interval...
Curated OER
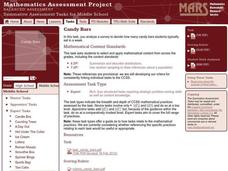
Candy Bars
There is often more to data than meets the eye. Scholars learn that they need to analyze data before making conclusions as they look at data that describes the number of candy bars boys and girls eat. They disprove a given conclusion and...
Statistics Education Web
10,000 Steps?
Conduct an experiment to determine the accuracy of pedometers versus pedometer apps. Class members collect data from each device, analyze the data using a hypothesis test, and determine if there is a significant difference...
Mathematics Assessment Project
Evaluating Statements about Probability
Learners first complete an assessment task where they assess statements on probability. They then sort cards containing probability statements as being either true or false.
EngageNY
Sampling Variability in the Sample Proportion (part 2)
Increase your sample and increase your accuracy! Scholars complete an activity that compares sample size to variability in results. Learners realize that the greater the sample size, the smaller the range in the distribution of sample...
EngageNY
Sampling Variability in the Sample Proportion (part 1)
Increase your sample and increase your accuracy! Scholars complete an activity that compares sample size to variability in results. Learners realize that the greater the sample size, the smaller the range in the distribution of sample...
EngageNY
Using Sample Data to Estimate a Population Characteristic
How many of the pupils at your school think selling soda would be a good idea? Show learners how to develop a study to answer questions like these! The lesson explores the meaning of a population versus a sample and how to interpret the...
EngageNY
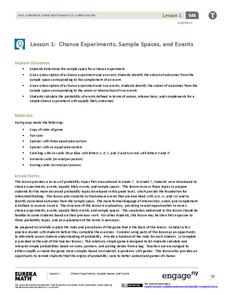
Chance Experiments, Sample Spaces, and Events
Want a leg up on the competition? Show classes how to use mathematics to their advantage when playing games. Learners calculate probabilities to determine a reasonable scoring strategy for a game.
Mathematics Assessment Project
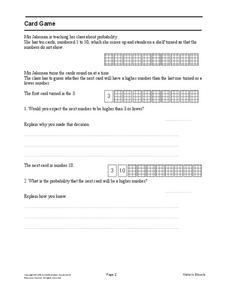
Card Game
Middle schoolers use 10 cards to determine whether the probability that the next card chosen is higher or lower than the previous.
Utah Education Network (UEN)
Probability and Statistics
MAD about statistics? In the seventh chapter of an eight-part seventh-grade workbook series, learners develop probability models and use statistics to draw inferences. In addition, learners play games and conduct experiments to determine...
Willow Tree
Data Sampling
Some say that you can make statistics say whatever you want. It is important for learners to recognize these biases. Pupils learn about sample bias and the different types of samples.
Houghton Mifflin Harcourt
Unit 6 Math Vocabulary Cards (Grade 6)
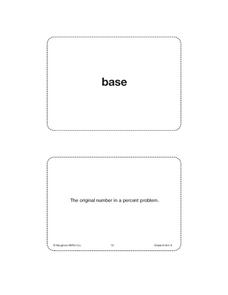
Fifty-eight flashcards make up a set designed to reinforce math vocabulary. Within the set, you'll find bold-faced word cards as well as definition cards that offer a labeled example. Terms include base, percent, theoretical...
Virginia Department of Education
The Real Meal Deal
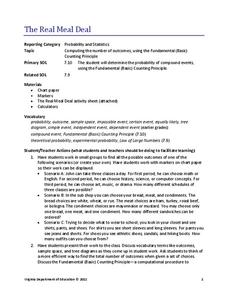
Burgers and salads and sodas, oh my! Scholars use a menu to investigate the Fundamental Counting Principle. They create tree diagrams to illustrate the number of possible choices for each given scenario.
Virginia Department of Education
What Are the Chances?
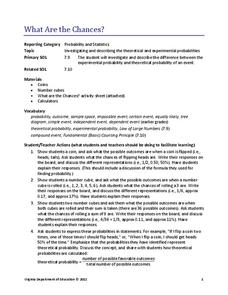
Take a chance on an informative resource. Scholars conduct probability experiments involving coins and number cubes to generate data. Compiling class data helps connect experimental probability to theoretical probability.
Math12
Basics of Probability
Give your students a fighting chance at understanding probability. Offering numerous examples that clearly demonstrate basic probability concepts, this resource helps young mathematicians learn how to visualize the...
Curated OER
Data Analysis, Probability, and Discrete Math
Choose to supplement your probability unit with this resource and you won't be disappointed with the outcome. Teach young mathematicians to organize information using tree diagrams and lists in order to determine the possible outcomes of...
Curated OER
Explorations for the Area Probability Applet
Math whizzes use the area probability applet to manipulate the size of the circle and the rectangle to explore the probability that a point in the rectangle is also in the circle.
Curated OER
Probability - Worksheet
Middle schoolers solve and complete four various types of problems. First, they list all the possible orders completed. Then, pupilscomplete the table and show all the outcomes of throwing a coin and spinning a spinner. They also use a...
Curated OER
Drawing One and Two Playing Cards With Replacement
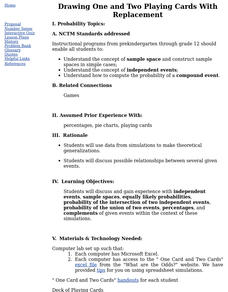
Math whizzes use data from simulations to make theoretical generalizations and discuss possible relationships between several given events. They use a simple card game to generate data to be analyzed.
Curated OER
Law of Large Numbers - Hospital
Pupils explore concepts of probability and independent events. They develop a formula for deviation percentage.
Curated OER
Integrated Algebra Regents Questions: Conditional Probability
In this conditional probability worksheet, students solve 1 short answer problem. Students determine the probability of selecting an English book given a scenario at the library.
Curated OER
Integrated Algebra Regents Questions: Combinations and Probability
In this combinations and probability worksheet, students solve 3 short answer problems. Students draw tree diagrams to represent possible outcomes in a sample space. Students determine the probability of an event.


