Curated OER
Data Collection and Presentation
Middle and high schoolers collect and analyze data from four different activities. The activities include information about classmates, tallying colors of cars in a parking lot, stem and leaf plots, and making a histogram from winning...
Curated OER
Going Graph-y
Second graders listen to and dicuss the story Where the Wild Things Are. They play a pantomime game and act out various feelings so their classmates can guess. They listen for the frequency of certain words, and record their findings on...
Curated OER
Pet Tally
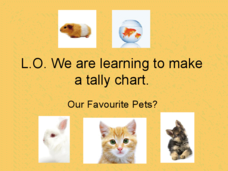
Give the class an opportunity to practice using tally marks as a way to collect data. As you progress through the slide show, learners tally up the number and types of pets they see, they then use their data to create a tally chart....
Curated OER
Reading Bar Charts
Help kids understand how to collect data through surveys, organize data in a bar chart, then analyze their findings. There are three different surveys for learners to conduct, a full description of all the parts of a bar chart, and three...
Pennsylvania Department of Education
What is the Chance?
Fourth and fifth graders make predictions using data. In this analyzing data lesson, pupils use experimental data, frequency tables, and line plots to look for patterns in the data in order to determine chance. You will need to make a...
Curated OER
Where We Live
Who has the most? Young learners practice charting data using familiar information. They help fill out a classroom chart by recording the number of people, pets, televisions, etc. in their home. Guiding questions help them investigate...
Curated OER
Count the Tally Marks!
How many tallies do you see? Learners examine eighteen sets of tally marks with values from 1-18, writing the number value beside them. Depending on how you want to use this, you may want to cut these out and have learners rearrange them...
Curated OER
Make a Table
First and second graders participate in an experiment then create a table of tally marks to identify the totals. They problem solve, tally twenty experiences, and generate an answer to one question.
Curated OER
Counting Coins
Second graders identify a quarter, dime, penny, nickel, and dime. They match the coin with it's monetary value, collect data on excel spreadsheet, and create a graph in Excel. Students participate in group activities.
Curated OER
Taking Attendance
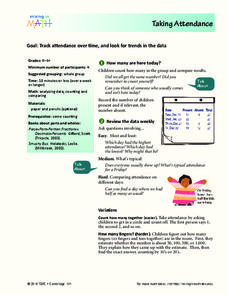
Young mathematicians record and analyze data. They will take attendance for their class and compare to other days. Then discuss ways to count who is present. They may also show the amount of learners present using fractions.
Curated OER
Make a Frequency Table and a Histogram for a Given Set of Data
In this data recording and data organization worksheet, students create one frequency table and one histogram for a given list of data. Explanations and examples for frequency tables and histograms are given.
Curated OER
Students Favorites
Students complete activities using a frequency table and construct a pie graph for the data. In this frequency table lesson, students complete a survey to find data for a frequency table. Students use the given link to make a pie graph...
Curated OER
Voting and Elections: Vote to Make a Difference
Students use a ballot to make a choice about two items to vote on. In this voting lesson plan, students discuss comparing choices between two items, the benefits and drawbacks to each, and make tally marks to total the votes.
Curated OER
Frequency Distributions
In this statistics worksheet, students solve 5 frequency problems. In four of the problems, the frequency table is provided and students construct one relative frequency table, one cumulative frequency table, and two cumulative relative...
Curated OER
Pets All Around
In this information table worksheet, students will survey their classmates to find out what types of pets they have at home and record the information using tally marks on a table. Then students will answer 6 short questions about the...
Curated OER
Grid: Multiplication and Tally Marks
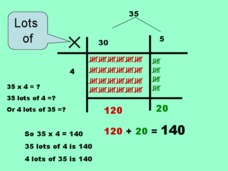
I wouldn't say that making and counting tally marks is the best way to solve a multiplication problems, but this PowerPoint may prove me wrong. Kids solve double-digit multiplication problems using a simplistic grid and tally marks. They...
Curated OER
Data Analysis: For Little Learners
Using pictographs, tally charts, and surveys, kids learn all about data analysis and collection. They make surveys, collect data, then construct pictographs and tally charts to organize their information.
Curated OER
Survey: What Shape Has More In the Lucky Charms Box?
For this Lucky Charms worksheet, students identify the shapes in the box, and using tally marks, count how many of each shape are included. This worksheet may be used in elementary grades, for counting and tally purposes, but it also can...
Curated OER
Tallying Animal Characteristics
Take a trip to the farm! While examining an image of farmyard animals, learners make two separate tallies: animals with two legs and animals with four legs. Then, they add up the numbers to find the total number of animals. They could...
Curated OER
Choose a Graph to Display Data
In this math graphs worksheet, students write line plot, tally chart, pictograph, or bar graph to tell the best kind of graph to use to answer the six questions.
Curated OER
Collect and Organize Data - Practice 14.1
In this data collection worksheet, students read the word problem and study the tally chart about favorite sports. Students then use the information in the chart to answer the questions. Students then use the list about students'...
Curated OER
Graphing
Intended for a faith-based classroom, this lesson requires second graders to create a survey, conduct the survey in multiple classrooms, and graph the results. They can choose between creating a picture or bar graph, or you can require...
Curated OER
All in the Family
Learners use data to make a tally chart and a line plot. They find the maximum, minimum, range, median, and mode of the data. Following the video portion of the lesson, students will visit a Web site to test their data collection skills...
Curated OER
What's Data?
Students get the opportunity to investigate the concept of data collecting. They explore how to tally and read a bar graph. Vocabulary about data is also be included. At the end of the lesson, individual students collect data independently.


