US Department of Commerce
How Does Our Class Compare?
Compare the class to the country. As a group, pupils collect data on the types of activities boys and girls do after school. Learners compare the number of girls to the number of boys for each activity. Using census data, individuals...
CK-12 Foundation
Understand and Create Histograms: Histograms
Tally ho! Represent the frequency of ages at school. Pupils finish a tally chart to match the frequencies of ages at school. Using the frequencies, the learners create a histogram. With the aid of the histogram and the frequency table,...
Curriculum Corner
Bugs and Flowers Math and Literacy Centers
The sun shines, flowers bloom, and bugs fly—it must be Spring! Add a cheerful theme of bugs and flowers to math and literacy centers. Scholars take part in an assortment of activities designed to reinforce concepts such as identifying...
Curriculum Corner
Valentine's Math and Literacy Centers
Look no further for a Valentine's Day-themed packet intended for math and literacy centers. Learners practice writing, reading, and representing numbers in a variety of ways, including skip counting by 2s, 5s, and 10s to 100. The pink...
Curriculum Corner
Valentine Math and Literacy Practice
Looking for math and literacy practice with a Valentine's Day theme? Look no more, because this 43-page packet is filled with practice pages intended to reinforce basic math, reading, and writing skills. From counting to writing words to...
Kid Zone
Groundhog's Day Graphing
This Groundhog's Day, challenge scholars to predict, estimate, tally, and graph in a weather-themed lesson in which class members play the role of the groundhog to forecast the weather come February second.
Royal Baloo
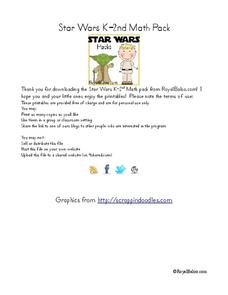
Star Wars K-2nd Math Pack
Included in a Star Wars themed packet, young padawans enhance mathematical skills such as graphing, computing using basic operations, counting numbers and money, telling time, and measuring. Scholars play a game of sudoku, read number...
Curated OER
Run, Gingerbread Men, Run!—Game
Run, gingerbread men! During the board game, four gingerbread men race to discover which one finishes first. Scholars take note of the game's results using a tally chart and bar graph for all to observe the frequency of the winning...
Mathed Up!
Tallys and Charts
After watching a brief instructional video, young mathematicians are put to the test. By completing and reading frequency tables, tally charts, and bar graphs, individuals show their understanding of how to interpret data.
Houghton Mifflin Harcourt
Unit 1 Math Vocabulary Cards (Grade 1)
Reinforce mathematical vocabulary with the use of flash cards. Each card showcases a boldly typed word as well as a labeled picture representation of the word. Terms include addition, subtraction, greater than, less than, and more!
Los Angeles County Office of Education
Assessment for the California Mathematics Standards Grade 1
Here is an assessment designed to test mathematicians' knowledge of writing numbers, comparing numbers, skip counting, solving addition and subtraction problems; along with measuring objects, telling time, identifying shapes, reading...
National Security Agency
Starting a Restaurant
Through an engaging unit, chefs-in-training will sort and classify data using tally charts. Learners will also create bar graphs to display restaurant data and interpret data from bar graphs using a variety of categories. This is a fun...
National Security Agency
Going Green with Graphs
For this unit designed for second graders, youngsters are introduced to conducting surveys and creating tally charts based on the data they gather. Students then construct bar graphs, and observe the relationships between the two types...
Student Handouts
Tournament Tally Cards
Use a progressive tally sheet to keep track of a class tournament. With seven rounds of two-table play, a place for noting points, and directions for use, the resource is a fun way for kids to compete in or out of class.
Houghton Mifflin Harcourt
Let’s Count!: English Language Development Lessons (Theme 5)
Counting is the theme of this compilation of ESL lessons. Through listening, speaking, and moving, your young learners take part in a variety of activities to enhance their English proficiency such as making menus and books,...
Math Learning Center
Fifth Grade Assessments and Scoring Checklists, Common Core State Standards
Check for understanding with a set of math assessments. Fifth graders answer questions involving multiplication and division, median and mode, rotational symmetry, and graphing.
Math Moves U
Collecting and Working with Data
Add to your collection of math resources with this extensive series of data analysis worksheets. Whether your teaching how to use frequency tables and tally charts to collect and organize data, or introducing young mathematicians to pie...
Inspired By Kindergarten
Numbers 1-10
Preschoolers and kindergartners can master numbers 1-10 with a set of math worksheets. Each page features one number that kids trace, represent with tally marks, and write what number they will have after adding or subtracting 1.
Curated OER
Tallies
Tally Marks are a wonderful way to keep track of data, and to foster counting for your young mathematicians. This resource has learners identify the correct number of tally marks for a given number. The numbers used are: 13, 15, 17, and...
Curated OER
Simple Tally Charts and Bar Graphs
Introduce your first graders to the world of tally marks, bar graphs, and the organization of data. Pupils determine a favorite ice cream flavor based on tally marks, then use a bar graph to answer some questions about sports. There are...
Curated OER
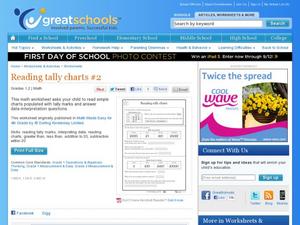
Reading Tally Charts #2
Keep count with tally marks! First graders practice reading tally marks with this straightforward learning exercise. They work with interpreting data from a chart, as well as working with addition and subtraction under 20. A great math...
Curated OER
Reading Tally Chart
As learners explore data analysis have them practice reading tally charts using these examples. They answer basic questions about each of three charts, employing addition and subtraction skills. For example, a chart tallying t-shirts...
Curated OER
Quantitative Data
In this quantitative data worksheet, pupils compute measures of central tendency, draw vertical line diagrams, and compare collected data. This 23-page worksheet contains approximately 100 multi-step problems. Explanations and examples...
Curated OER
Dot Plots
Number crunching statisticians explore displaying data with dot plots and define the difference between quantitative data and qualitative data. Dot plots are created based on a set of given data and analyzed.


