CK-12 Foundation
Applications Using Linear Models: Scuba Diving
Dive into this resource on rates of change and linear models. Pupils use two sliders in an interactive to adjust water temperature and depth. They use a given linear equation to calculate the rate of change in water temperature per unit...
NASA
Ripening of Fruits and Vegetables
How long do fresh foods last in space at the International Space Station? Which foods perish quicker than others? How can astronauts preserve their foods to make them last longer in space? Young scientists test the rates at which some...
PBL Pathways
College Costs
Predict the year that college costs will double in your state using linear modeling. The first part of this two-part project based learning activity asks young mathematicians to use data from the College Board. They graph the data, write...
Noyce Foundation
First Rate
Explore distance and time factors to build an understanding of rates. A comprehensive set of problems target learners of all grade levels. The initial problem provides distance and time values and asks for the winner of a race. Another...
Virginia Department of Education
Linear Modeling
An inquiry-based algebra instructional activity explores real-world applications of linear functions. Scholars investigate four different situations that can be modeled by linear functions, identifying the rate of change, as well as the...
EngageNY
The Slope of a Non-Vertical Line
This lesson introduces the idea of slope and defines it as a numerical measurement of the steepness of a line. Pupils then use the definition to compare lines, find positive and negative slopes, and notice their definition holds for...
California Mathematics Project
Meteorology
See how estimation is essential to making temperature weather maps. Scholars use ratios and rates of change to estimate temperatures at locations where temperature readings have not been made. They connect this idea to linear functions.
EngageNY
Average Rate of Change
Learners consider the rate of filling a cone in the 23rd installment of this lesson series. They analyze the volume of the cone at various heights and discover the rate of filling is not constant. The lesson ends with a discussion of...
Mathematics Common Core Toolbox
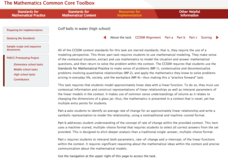
Golf Balls in Water
Here's a resource that models rising water levels with a linear function. The task contains three parts about the level of water in a cylinder in relationship to the number of golf balls placed in it. Class members analyze the data and...
EngageNY
Mid-Module Assessment Task: Grade 8 Module 6
Make sure pupils have the skills to move on to the second half of the module with a mid-module assessment task. The formative assessment instrument checks student learning before moving on to the rest of the lessons in the unit.
EngageNY
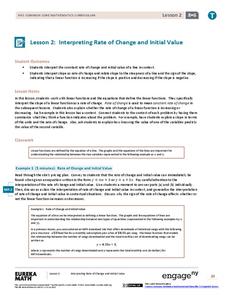
Interpreting Rate of Change and Initial Value
Building on knowledge from the previous lesson, the second lesson in this unit teaches scholars to identify and interpret rate of change and initial value of a linear function in context. They investigate how slope expresses the...
EngageNY
End-of-Module Assessment Task: Grade 8 Module 5
Give your class a chance to show how much they've learned in the module with an end-of-module assessment task that covers all topics from the module including linear and non-linear functions and volumes of cones, cylinders, and spheres.
Statistics Education Web
What Does the Normal Distribution Sound Like?
Groups collect data describing the number of times a bag of microwave popcorn pops at given intervals. Participants discover that the data fits a normal curve and answer questions based on the distribution of this data.
Balanced Assessment
Oil Consumption
An assessment presents a chart displaying oil consumption Pupils use the chart to determine the greatest increase in consumption, and then apply that information to figure out when the consumption may reach 100 million barrels a day.
Balanced Assessment
Ford and Ferrari
Which is faster, a Ford or a Ferrari? The short assessment has pupils analyze graphs to determine the rates of change between the two. Individuals interpret the rates of change within the context of speeds of the cars and develop a map...
EngageNY
Comparing Linear Functions and Graphs
How can you compare linear functions? The seventh installment of a 12-part module teaches learners how to compare linear functions whose representations are given in different ways. They use real-world functions and interpret features in...
EngageNY
Graphs of Linear Functions and Rate of Change
Discover an important property of linear functions. Learners use the slope formula to calculate the rates of change of linear functions. They find that linear functions have constant rates of change and use this property to determine if...
EngageNY
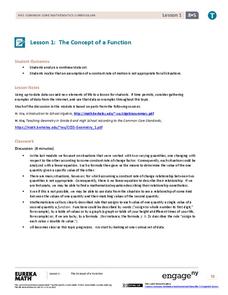
The Concept of a Function
Explore functions with non-constant rates of change. The first installment of a 12-part module teaches young mathematicians about the concept of a function. They investigate instances where functions do not have a constant rate of change.
Balanced Assessment
On Averages and Curves
Determine the average on a curve. The class finds graphical representations of averages and expresses them both symbolically and on the graph. The assessment requires class members to justify using average to describe graphs.
Bowland
Torbury Festival
Have you been to Torbury Fair? In the set of four lessons, learners solve a myriad of problems related to a music festival, including situations involving floods, market stalls, cows, and emergency plans.
Bowland
In the Olympics, are Women Improving Faster than Men?
Will the time come when women outperform men at the Olympic Games?Scholars investigate gender differences in Olympic Games performances. They study the historical participation of women and then analyze data to determine if women will...
Bowland
My Music
Scholars investigate how the tempo of music affects heartbeats. Groups develop hypotheses about music and its connection to heartbeats before carrying out an experiment. They analyze and present data from their investigations.
Bowland
Alien Invasion
Win the war of the worlds! Scholars solve a variety of problems related to an alien invasion. They determine where spaceships have landed on a coordinate map, devise a plan to avoid the aliens, observe the aliens, and break a code to...
Inside Mathematics
Swimming Pool
Swimming is more fun with quantities. The short assessment task encompasses finding the volume of a trapezoidal prism using an understanding of quantities. Individuals make a connection to the rate of which the pool is filled with a...


