Curated OER
Table of Measures and Area
For this measurement and area worksheet, students complete a table by carefully estimating and then measuring the listed objects. They find 3 objects to measure, use the proper measuring tool, and complete table. They can complete a...
Curated OER
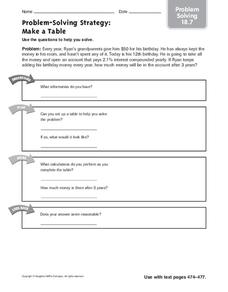
Problem Solving: Make a Table
In this making a table worksheet, 6th graders use the problem solving strategies of understand, plan, solve, and look plan, to solve a word problem.
Curated OER
Place Value Through Hundred Thousands
In this place value worksheet, students study and examine the data in a table about 5 popular female names. Students solve 4 word problems utilizing the data from the table.
Curated OER
Pounds of Paper
For this collecting of data worksheet, 2nd graders study and analyze a pounds of paper table in order to solve and answer 6 mathematical questions.
Curated OER
Dance Decisions
In this making decisions learning exercise, 5th graders look over two charts/tables involving dance decisions and answer six mathematical questions relating to the charts/tables.
Curated OER
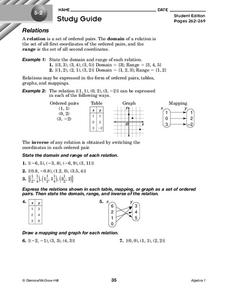
Relations
In this relations worksheet, 10th graders solve and complete 7 different problems that include defining various relations of number sets. First, they state the domain and range of each relation. Then, students express the relations shown...
Curated OER
Tables Grids
In this multiplication worksheet, learners learn how to fill out a multiplication table or grid. They then fill one out on their own with 36 blank spaces. The answers are on the last page.
Curated OER
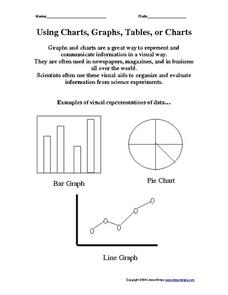
Using Charts, Graphs, Tables, or Charts
In this charts, graphs and tables worksheet, learners view 3 different types of visual representations of data, make a list of 20 items and decide how the items can best be put together in groups to make a graph, chart or table. Students...
Curated OER
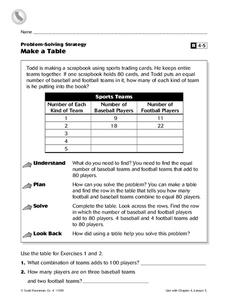
Make a Table
In this charting worksheet, 4th graders complete a table. Using the information provided, students fill in the missing data and complete 2 short answer questions.
Curated OER
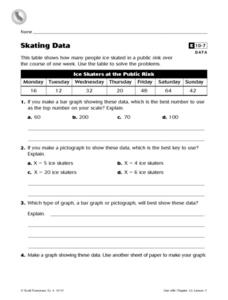
Skating Data
In this collecting data worksheet, 4th graders view a table on ice skaters at a public rink in order to answer 2 multiple choice questions, 1 short answer question and make a graph showing one piece of the data.
Curated OER
Word Problem Solving Strategies
In this word problem solving strategies learning exercise, 6th graders solve and complete 11 different problems and questions related to identifying word problems. First, they explain what the problem is telling them to do and what is...
Curated OER
Using A Table
In this table activity, middle schoolers observe information in a table, and then answer ten questions pertaining to the information. They must correctly read a table in order to arrive at the correct answer. Questions pertain to...
Curated OER
Graphing
Students gather statistical information on a chosen topic and place it into a spreadsheet. Using th Excel chart wizard, students create tables, graphs and charts of their information. They interpret the data and share it with the class.
Curated OER
Charting and Graphing Sales
Students analyze and represent weekly sales figures using tables, bar graphs, and pie charts. They draw conclusions using bar graphs and pie charts. Students are told that each day at school they have the option of buying or bringing a...
Curated OER
Compare and Contrast Culture
Fifth graders compare and contrast the cultures of American culture with that of the other cultures of North America. Using traditional and Internet research, 5th graders gather data on one element of culture for comparison. Data...
Curated OER
Data From Interviews
Students create and conduct a survey about favorite foods, gather and represent the data, interpret data and make predictions to present to the class. They create and use interview questions to gather data. Pupils are explained that...
Curated OER
Information at a Glance - Using Tables in Mathematics
High schoolers create table to display GED Testing data located in paragraph provided by teacher, use information in table to create appropriate graph, and determine percentage difference between passing scores and failing scores.
Curated OER
The Why and How of General Terms
Sixth graders find the recurrence relation for simple sequences
construct tables of values for a pattern. They find the value of the general term of a sequence algebraically.
Curated OER
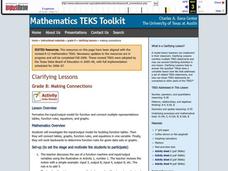
Making Connections
Eighth graders investigate the input/output model for building function tables. From the data, 8th graders connect tables, graphs, function rules, and equations in one variable. They work backwards to determine function rules for given...
Curated OER
An Immigration Graph
Young scholars practice reading and understanding information in a table and converting the information to graph form. They create a graph showing the number of immigrants per country of origin between 1899 and 1924.
Curated OER
A Data Processing Lesson for Statistics -- Reading a Table or Chart
Young scholars identify the structure and key parts of tables and charts. They determine which data is meanjngful and make comparisons with the data. They describe the scope of the AIDS plague throughout the world.
Curated OER
How to Buy a Computer
High schoolers investigate the purchase of a specific computer hardware with specific components without going over a budget. The use of computer catalogues, tables, and spreadsheets support the search.
Curated OER
Technical Literacy
Young scholars explore the components of the transference of technological information through this ten lesson unit. The applications to specific careers, the determination of responsible use of technology, and the affects of technology...
Curated OER
Seaside Science
Students classify sea life and shells and develop computer-generated tables and graphs. They observe a desalinization demonstration and enter information on their laptops through each step of the scientific experimental process.


