Curated and Reviewed by
Lesson Planet
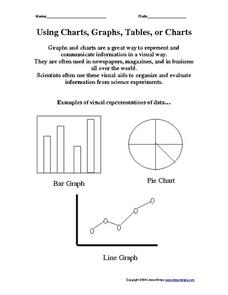
In this charts, graphs and tables learning exercise, students view 3 different types of visual representations of data, make a list of 20 items and decide how the items can best be put together in groups to make a graph, chart or table. Students then make a graph, chart or table to show how they can organize the groups.
14 Views
70 Downloads
Resource Details


