Association of American Geographers
Project GeoSTART
Investigate the fascinating, yet terrifying phenomenon of hurricanes from the safety of your classroom using this earth science unit. Focusing on developing young scientists' spacial thinking skills, these lessons engage...
Discover Earth
Weather Stations
Transform your classroom into a fully functioning weather station with this series of hands-on investigations. Covering the topics of temperature, precipitation, wind patterns, and cloud formation, these activities engage young...
Illustrative Mathematics
Weather Graph Data
Teaching young mathematicians about collecting and analyzing data allows for a variety of fun and engaging activities. Here, children observe the weather every day for a month, recording their observations in the form of a bar graph....
California Academy of Science
California's Climate
The United States is a large country with many different climates. Graph and analyze temperature and rainfall data for Sacramento and Washington DC as you teach your class about the characteristics of Mediterranean climates. Discuss the...
Curated OER
How Does Your Garden Grow? Discovering How Weather Patterns Affect Natural Cycles
For the warm-up in this cool climate lesson, you will need to click on "Mapping" and then "US Mapping" once you arrive at NOAA's "US Climate at a Glance" page. Earth science explorers realize that 2012 was a warm winter for us. They read...
Curated OER
Air Pollution: What's the Solution?
This air pollution worksheet provides a step-by-step process for gathering data about the ozone and weather. Amateur meteorologists enter data for 3 days including the air quality, the temperature, the wind speed, any particular events...
Living Rainforest
Finding the Rainforests
From Brazil to Indonesia, young scientists investigate the geography and climate of the world's tropical rain forests with this collection of worksheets.
Curated OER
TV Weather Announcers
Elementary schoolers collect and record weather data for their local area using data from newspapers, Web sites, and television reports. The read and record data daily, and groups prepare a presentation on their findings for the entire...
Curated OER
Graphing the Forecast-Line Graph or Bar Graph?
Students explore bar and line graphs. In this data collection, graphing, and weather lesson, students compare bar and line graphs and discuss which type of graph would be most appropriate for displaying a ten day weather forecast....
Curated OER
Adopt a City-Winter Weather
In weather worksheet, students use an on line site to collect weather data. They create 10 different weather scenarios using a temperature and humidity slider. They includethe temperature, relative humidity and weather conditions and...
Curated OER
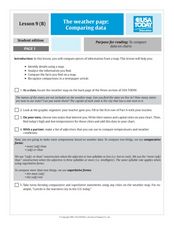
The Weather Page-Comparing Data
Young scholars examine weather patterns in the United States. In this weather lesson, students use a United States map to identify high and low temperatures in two states. Young scholars compare the data and record their findings onto a...
Curated OER
Weather Reporter
Fourth graders generate an oral presentation on the weather. In this weather activity, 4th graders watch the weather for a week and record the data on a chart. Students give a weather report at the end of the week.
Curated OER
Weathervanes in the Wind
Students investigate wind and weather by creating a weathervane. In this environment lesson, students identify the purpose of a weathervane and observe weathervanes in action on their campus. Students create a weathervane and...
Curated OER
Weather "Whys"
Students complete activities to explore fall weather. In this weather lesson, students use the given links to examine weather forecasts. Students complete a weather graph activity and watch Internet field trips. Students complete fall...
Curated OER
Weather "Whys"
Students explore the weather. In this weather data lesson, students collect weather data from Internet and media sources. Students graph the collected data discuss it as well as the seasons of the year.
Curated OER
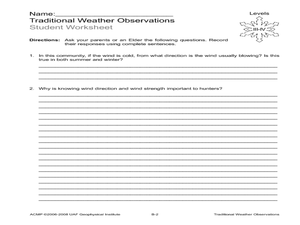
Traditional Weather Observations
Students explore traditional methods of weather observation. In this weather lesson, students interview grown-ups regarding wind. Students learn how winds can help forecast weather.
Curated OER
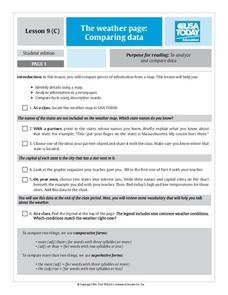
The Weather Page: Comparing Data
Learners analyze data from maps. In this comparing data lesson, students use comparative and superlative statements to draw comparisons among the weather in different American cities based on USA Today weather maps.
Curated OER
Mean, Median and Mode
Fourth graders describe weather data using the mean, median and mode. In this mean, median and mode lesson, 4th graders understand how to calculate data using mean, median and mode and why they would use each one.
Curated OER
Creating Weather Journals
Students create weather journals. In this weather science lesson, students use digital cameras to record the daily weather and write a paragraph in a weather journal.
Curated OER
Creating a Mathematical Model Using Weather Data
Students explore the concept of mathematical models. For this mathematical model lesson, students create a mathematical model from data from 4 cities over 15 months. Students are told they are working for a weather station. Students...
Alabama Learning Exchange
Weather Detectives
Second graders make weather observations and record data. They use the internet to get data on the weather. After 5 days students predict the weather for the next 3 days.
Curated OER
Conducting and Analyzing Local Studies
Students carry out the class weather study: recording, organizing and discussing data daily and keeping track of this work in their journals. They look for patterns and relationships in data, link these with what they know and with...
Curated OER
"Weather Watch"
Students investigate components of weather and the climate in areas around the country. They analyze data from the University of Michigan weather website, complete a weather watch worksheet, and graph weather data.
Curated OER
Weather with Lewis and Clark
Students track the weather and temperature for the same time period that Lewis and Clark were at Fort Mandan. The students compile data and use it for comparisons.


