Curated OER
Data and charts
In this data and charts worksheet, students answer multiple choice questions referring to different charts about mountain heights, breakfast drinks, and more. Students complete 10 multiple choice questions.
Curated OER
Charts and Graphs
In this charts and graphs worksheet, students refer to charts and graphs to solve word problems. Students complete 10 multiple choice word problems.
Curated OER
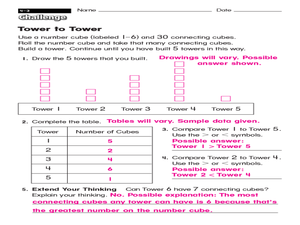
Building Towers with Number Cubes
In this building towers with number cubes learning exercise, 2nd graders build number cube towers by rolling a dice, then complete a data chart to compare the number of cubes in each tower.
Curated OER
Working Out The Workout: Chart Activity
In this chart worksheet, students complete one column in a chart to determine total hours of exercise time, then use the chart to complete 4 additional questions.
Curated OER
Fore!
In this golf worksheet, students fill in data in a chart about 6 tournaments and answer short answer questions about it. Students fill in 18 spaces in the chart and answer 2 questions.
Curated OER
Meter Reading Using Place Value
Fourth graders watch a video about reading a gas meter and discuss what they saw in the clip. In this place value lesson, 4th graders complete a worksheet where they fill in the missing dials on the meters.
Curated OER
Completing frequency diagrams from displayed data
In this frequency worksheet, students use data in graphs and charts to complete a frequency diagram. Students fill in 26 spaces in the diagram.
Curated OER
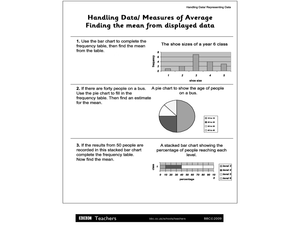
Handling Data/Measures of Average - Finding the Mean from Displayed Data
In this mean and average worksheet, students use the bars and charts to help them find the means using the given data. Students solve 3 problems.
Curated OER
A Planet Full of Animals
Students study animals and practice classifying them through observation activities. In this animal classification lesson plan, students complete a KWL chart about animals. Students then sort pictures of animals into chart categories...
Curated OER
Diagnosing Allergies Through Data Collection
Students research and organize information about allergies. In this data collection lesson, students watch a video about allergies. Students create a histogram using the information collected. Students complete the 'Displaying Survey...
Curated OER
Songs from the Past
Students research songs from the past to learn about historical events. In this music history lesson, students conduct a survey on the Star-Spangled Banner, research the song and history on various websites, and research songs in the...
Curated OER
Using Graphs and Charts
Pupils complete T charts and manipulate numbers using graphs and charts. In this math graphs and charts lesson, students review the concepts of pattern and function. Pupils then complete practice pages where they manipulate numbers to...
Curated OER
Santa's List Sums (G2)
In this Christmas math worksheet, students help Santa know the number of children on the given streets in the chart. Students find the sum of the boys and girls for the 17 problems.
Curated OER
Activity Plan 4-5: I'm Graphing to Know You!
Learners create graphs about themselves to learn more about one another. In this early childhood math lesson, students record information about one another as they make picture graphs.
Curated OER
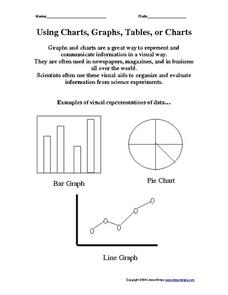
Using Charts, Graphs, Tables, or Charts
For this charts, graphs and tables worksheet, students view 3 different types of visual representations of data, make a list of 20 items and decide how the items can best be put together in groups to make a graph, chart or table....
Curated OER
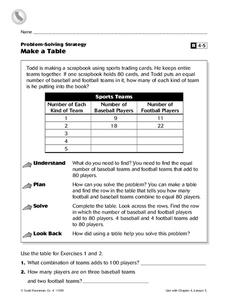
Make a Table
In this charting worksheet, 4th graders complete a table. Using the information provided, students fill in the missing data and complete 2 short answer questions.
Curated OER
Types of Data
In this data chart learning exercise, students read the directions and study the examples to learn the difference between qualitative, quantitative, discrete and continuous data. Students answer 24 questions. This page is intended to be...
Curated OER
Scientific Method
In this science worksheet, students identify and locate each of the words to the right in the word search puzzle on the left. Then they list as many words as they can from the letters in scientific method.
Curated OER
Using A Table
In this table worksheet, learners observe information in a table, and then answer ten questions pertaining to the information. They must correctly read a table in order to arrive at the correct answer. Questions pertain to features of...
Curated OER
Weather Calendar
In this weather calendar worksheet, students read the calendar and identify the type of weather that occurred on that date. They also determine the total number of days that were cloudy, sunny, etc. There are 9 questions on this...
Curated OER
Temperature
In this temperature instructional activity, students color a thermometer to depict the given temperature. They then compare, contrast temperatures and answer given thinking questions. There are approximately 20 questions on this...
Curated OER
Weather Instrument Data Chart 2
In this science worksheet, pupils look for the data that is needed to fill in the graphic organizer. The prefixes are given that are needed to sort the information as it is collected.
Curated OER
Reading Immigration Graphs and Charts
Students examine the settlement patterns and land use in Minnesota. In groups, they practice reading immigration graphs and charts and discuss why immigrants settled where they did. They are also introduced to new vocabulary related to...
Curated OER
Graphs Review
Seventh graders review different types of graphs such as bar graphs, line graphs, box & whisker plots. As a class, they read a story and construct graphs to solve the data in the story. Students play "Graph Jeopardy" which requires...


