Curated OER
Introduction to Scatter Plots and Correlation
Students examine the concept of scatter plots. They compare baseball statistics to locate the ones that correlate with winning, and identify the positive, negative, and no correlation in sets of data using MS Excel.
Curated OER
Commercial Salmon Fishing
High schoolers work with data about commercial fishing ofsalmon in Alaska. Students gather data, graph it, and analyze it.
Curated OER
Line Of Best Fit: Feet & Forearms
Students actively find the line of best fit. They gather their own data and then use a calculator to find the line of best fit, as well as the equation. They see how to use the TI 81 calculator in order to find the line of best fit.
Curated OER
What Can Scatterplots Tell Us?
Eighth graders use data from surveys conducted with parents, peers and themselves to create computer-generated scatterplots. They make inferences from their scatterplots.
Curated OER
Bungee M&M's
Eighth graders experiment with M&M's and a cup attached to a spring to to simulate a bungee jump. They graph the results of the experiment and make predictions for continuing the experiment. They determine the "line of best fit."
Curated OER
Drops on a Penny
Eighth graders experiment to determine the number of drops of water a heads up penny hold. They create a stem and leaf graph of the class results and use the data for further experimentation on a tails up penny.
Science Buddies
Science Buddies: That's a Real Smile! .Or Is It?
If someone is smiling, it means they're happy, right? Well, not always. Sometimes people smile to be polite, or because they want to "appear" happy or friendly for social reasons. How easy is it to spot which smiles are genuine and which...
University of Hawai'i
University of Hawaii: Understanding Correlation
This page gives a lot of information on correlation, including a section on the coefficient of correlation.
Google
Google for Education: Correlation vs Causation
In this lesson, students will test the strength of a correlation and discern whether or not a law or conclusion can be made based on that correlation. Students will see the threshold commonly accepted for correlating data and test their...
Texas Education Agency
Texas Gateway: Interpreting Scatterplots
Given scatterplots that represent problem situations, the student will determine if the data has strong vs weak correlation as well as positive, negative, or no correlation.
Varsity Tutors
Varsity Tutors: Hotmath: Practice Problems: Correlation and Lines of Best Fit
Twenty problems present a variety of practice determining correlation based on data in a scatter plot and using lines of best fit with given data. They are given with each step to the solution cleverly revealed one at a time. You can...
Math Is Fun
Math Is Fun: Scatter Plots
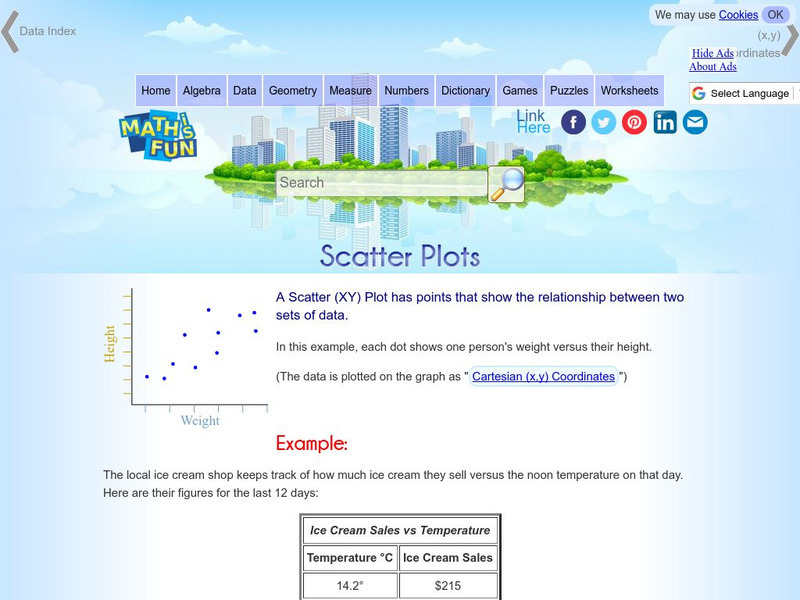
Explains, with examples, what scatter plots are and how to interpret the data. Discusses trends, interpolation and extrapolation, and correlation. Includes a set of practice questions.
Annenberg Foundation
Annenberg Learner: Against All Odds: Inside Statistics: Correlation
Twin studies track how similar identical and fraternal twins are on various characteristics, even if they don't grow up together. Correlation lets researchers put a number on it. Scroll down the page to find comprehensive student and...
National Institute of Standards and Technology (NIST)
Nist: Engineering Statistics Handbook: Scatter Plots and Linear Regression
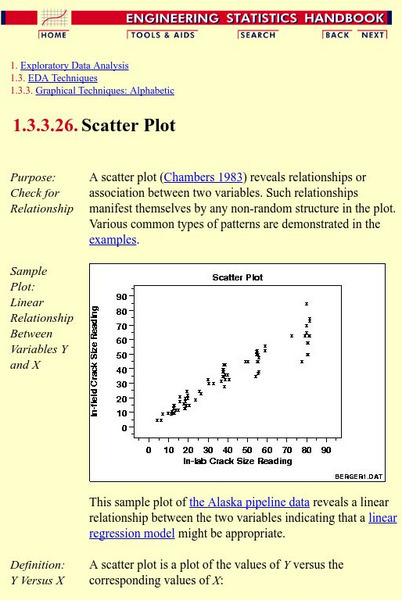
An explanation of scatter plots followed by examples of the many different kinds of scatter plots.
Oswego City School District
Regents Exam Prep Center: Scatter Plots and Line of Best Fit
Use this lesson, practice exercise, and teacher resource in planning instruction on scatter plots and line of best fit. In the lessons, you'll find definitions and examples of ways to make a scatter plot, determine correlations, and find...
Brown University
Brown University: Seeing Theory
This resource provides interactive visualizations of probability concepts. Covers basic probability, compound probability, probability distributions, frequentist inference, Bayesian inference, and regression analysis. The authors are...
Missouri State University
Missouri State U.: Introductory Statistics: Concepts, Models, and Applications
This is a comprehensive online text about statistics which covers all the basic concepts.
Houghton Mifflin Harcourt
Holt, Rinehart and Winston: Homework Help Independent Practice: Scatter Plots
Get independent practice working with scatter plots. Each incorrect response gets a text box explanation and another try. Correct responses are confirmed.
Texas Instruments
Texas Instruments: Numb3 Rs: "Take Out" Outliers
Based off of the hit television show NUMB3RS, this lesson has students create box-and-whisker plots for given data, and then determine which (if any) data points are outliers. Students determine outliers through two methods in this...
Ministry of Education and Universities of the Region of Murcia (Spain)
Ministerio De Educacion Y Ciencia: Variable Estadisticas Bidimensionales
In Spanish. This interactive unit shows you the statistical relationship between two variables.
Other
Stat Soft: Statistics Glossary
Dozens of statistical terms are defined and illustrated in this glossary.
McGraw Hill
Glencoe Mathematics: Online Study Tools: Self Check Quiz on Linear Equations
The online assessment displays knowledge of concepts used in Algebra I. The multiple choice questions test learners on analyzing linear equations. Topics include calculating the equation of a line and interpreting correlation.
Georgia Department of Education
Ga Virtual Learning: Historical Geology
In this interactive tutorial you will explore how geologists use clues in rocks to determine the order in which rocks formed. Learn how principles of radioactivity are used to assign actual ages to rocks. Students will explore fossils...
Famous Scientists
Famous Scientists: Francis Galton
Learn about the life and work of the father of eugenics, and find out how he contributed to the research on human intelligence.


