Curated OER
Science of Special Effects
This is a creative, multidisciplinary, well-designed lesson provided by Scientific American related to special effects. Students make their own animated short films and use math and computer skills.
Curated OER
Teaching with Collections
Learners examine collections. In these real-world collections lessons, students examine and describe buttons and shells. Learners will then sort, classify, and graph items according to various indicated descriptors.
Curated OER
The Blues . Writing . Biographies/Profiles . The Soul of a Man
This lesson, focused on profile writing and its unique characteristics, considers the profiles developed in the film The Soul of a Man while also asking learners to consider other profiles they are familiar with and to write some of...
Curated OER
The Numbers Tell the Story
Students demonstrate how to gather and interpret statistical data. In this data analysis instructional activity, students search for statistics on the health effects of smoking and place the information into charts. Students create these...
Curated OER
Applied Science - Built Environment Lab
Students evaluate trash. In this Science instructional activity, students collect and weigh trash from their classrooms. Students categorize the trash and the corresponding weights, recording the information on a data sheet.
Curated OER
Patterns Here, There, and Everywhere!
Upper graders access the Microsoft Word program and create patterns by utilizing certain keys on the keyboard. They create picket fences, smiley faces, and hearts. It seems that this lesson has as much to do with keyboarding skills as it...
Curated OER
Squanto's Science Lesson
Students explore Squanto's contribution to the settlers. They plant seeds and follow instructions for water and fertilization. Students keep a record of the growth of the seeds. They write a paragraph that tells what they learned from...
Curated OER
Exploring Probability
Fourth graders play a dice game as a group and record the number rolled. They report their findings and discuss terminology and ways of writing what the odds are of getting certain numbers.
Curated OER
Comparison Shopping
Elementary schoolers explore the concepts associated with comparison shopping, and the concept of need versus want. They also look closely at the power of advertising and become more aware of the messages that ads present. After taking...
Curated OER
Show Me!
Students analyze and interpret graphs. For this graphing lesson, students view a video and construct their own graphs (line, circle, bar) from given sets of data.
Curated OER
Misleading Graphs
Students explore number relationships by participating in a data collection activity. In this statistics lesson, students participate in a role-play activitiy in which they own a scrap material storefront that must replenish its...
K12 Reader
Eratosthenes: Geographer and Mathematician
Mathematicians can be famous, too! Introduce your class to Eratosthenes with a reading passage. After they complete the passage, learners respond to five questions, some of which require opinions and others reading comprehension skills.
Curated OER
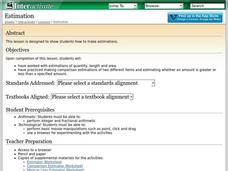
Estimation
Learners explore the concept of estimation. In this estimation activity, students discuss making estimates through teacher led discussion. Learners use the Internet to complete an activity where they must estimate the length of lines.
Curated OER
Multiplying by 10, 100, & 1000
Students understand that a shortcut can be used when multiplying by 10, 100 & 1000. In this multiplying lesson, students mentally multiply by 10, 100 & 1000. Students complete a worksheet with multiplication problems.
Curated OER
Teaching Money
Students identify coin/money values, write amounts of money and calculate change. The poem, "Smart" by Shel Silverstein is used in this instructional activity.
Curated OER
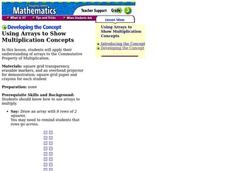
Using Arrays to Show Multiplication Concepts
Students draw arrays. In this multiplication lesson, students draw arrays, write multiplication sentences for arrays and discuss how changing the order of the factors affects the product.
Curated OER
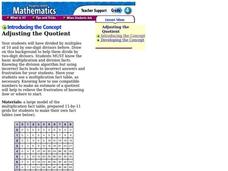
Adjusting the Quotient
Fourth graders use number facts to estimate quotients. In this division lesson, 4th graders examine long division problems to determine which multiple of ten will help them determine a number that is close to a quotient. They adjust the...
Curated OER
Bell Curve
Learners explore averages by completing a data analysis activity. In this bell curve lesson plan, students measure different food items and plot their measurements on a X and Y axis. Learners create bell curves around the average weight...
Curated OER
Working Watermelon
You're going to wish you had a watermelon for this lesson! Class members read about watermelons and make a salad in class to sample. They also perform estimates, measurements and calculations on a watermelon. They predict what percentage...
Curated OER
By The Pound
Students develop mathematical skills using measurement in the form of weight. They also perform calculations to find cost and strengthen estimation skills while comparing the actual price. The context for the lesson plan is in the...
Curated OER
"M&Ms"® Candies Worksheet 1
In this math worksheet, students find the likelihood of different outcomes with the use of M and M's candy for the seven questions and fill in the graphic organizer.
Curated OER
The Colored Cube Question
Fourth graders examine how to determine the probabilities or likelihood of outcomes. They complete trials to determine probability while using different manipulatives. They determine how games can be made fair or unfair in this unit of...
Curated OER
Probability Plus
Students participate in a variety of activities to understand statistics. They collect and interpret data. Also students distinguish the difference between a population and a sample. They make inferences and create arguments using data.
Curated OER
The Car Pool is Coming
Students evaluate the number of people who travel out of their town to work. They figure out what the percentage of each town's commuting workers is to the number who commute in the region. They plot the percentages on a pie chart.
Other popular searches
- Probablity Math Lessons
- Probability Math Lessons
- Math Lessons Probabilities
- Math Lessons/ Probability
- Math Lessons on Probability


