Curated OER
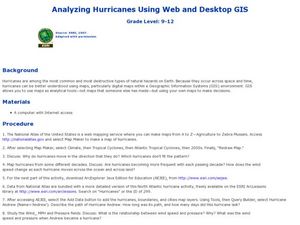
Analyzing Hurricanes Using Web and Desktop GIS
Students analyze hurricanes. In hurricanes activity, students use the Internet and GIS to analyze hurricanes. Students view the National Atlas of Maps to discuss the direction hurricanes move. Students study the wind and pressure fields...
Curated OER
Using Maps to Make Public Health Descisions Case Study: Harmful Algal Blooms in the Gulf of Mexico
High schoolers are introduced to GIS and its uses. Students participate as public health scientists to deliberate a course of action to explore possible research questions. Pupils interpret spatial data, and make predictions based on GIS...
Curated OER
Data Processing
Students explore the application of Geographic Information Systems (GIS) in a variety of businesses and organizations. They present proposals, representing different businesses and organizations, that support how GIS technology could...
Curated OER
Mapping Lab and Lead Poisoning
Students are introduced to GIS and its uses. They make predictions before viewing the actual lead poisoning cases by location of Dade County. Pupils use actual Miami-Dade County spatial data to explore basic principals. Students
Curated OER
US City Quality of Life Analysis and Comparison
Students analyze US census data and criteria to compare and measure the quality of life in the country's fifty largest cities. After accessing the 2005 quality of life world report online, students conduct their study to compare three...
Curated OER
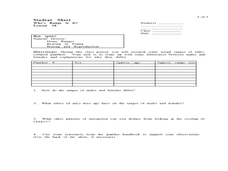
Who's Range is it?
Students investigate the habits of panthers by analyzing radio transmitted data. In this animal life lesson, students utilize computers to view the range of different statistics dealing with Florida panthers. Students...
Curated OER
Climographs
Students identify trends and characteristics of climate zones and specific places within. Then, they graph annual climate trends (primarily Temperature and Precipitation) and create, interpret and extrapolate information based on...
Curated OER
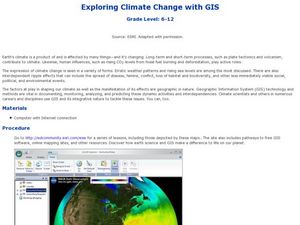
Exploring Climate Change with GIS
Students investigate climatological changes that are occurring to the Earth. In this climate change lesson, students access an assigned web site to view maps and lessons that show how climate change makes a difference to life on Earth.
Curated OER
World Cities of 5 Million or More
Students consult online resources to identify and map the world's largest cities and metropolitan areas. They analyze birth rates, settlement patterns and other demographic data and make predictions for the future. They write essays...
Curated OER
Mapping Population Changes In The United States
Students create a choropleth map to illustrate the population growth rate of the United States. They explore how to construct a choropleth map, and discuss the impact of population changes for the future.
Curated OER
Macbeth Madness
Learners participate in various social studies activities in correlation to William Shakespeare's Macbeth. In this Macbeth lesson, students study maps of Scotland, England, and Norway to identify locations mentioned in Macbeth. Learners...
Curated OER
U.S. History: What Happened Here?
Students apply the global positioning system to create maps of local historical sites. By collaborating with local historical groups, they research events and relate them to broader, national history. In addition to writing essays...
Curated OER
Journey of Discovery and Rivers
Learners investigate the rivers encountered and mapped by the Corps of Discovery. They analyze maps, outline and label rivers on a blank map, complete a chart, and answer discussion questions while watching a National Geographic video,...
Curated OER
Facts, Fictions and Perceptions of Regions
Learners examine the different characteristics of the regions of the United States. They discuss places they have visited in the U.S., and in small groups conduct research on a selected region of the U.S. Each group labels a map of...
Curated OER
Different Perspectives of Oregon's Forest Economic Geography
Learners map data on employment in wood products manufacturing in Oregon counties. In this Oregon forest lesson, students discover the percentage of people employed in the forest manufacturing industry. Learners create a box and whisker...
Curated OER
A Contouring We Go
Students examine the built environment and infrastructures of their community by constructing contour equipment, using the equipment, and comparing their results to current topographical maps of the same area
Population Connection
The Human-Made Landscape
Agriculture, deforestation, and urbanization. How have human's changed the planet and how might we mitigate the effects of human activity on the planet? To answer these questions class members research the changes in human land use from...
Curated OER
Radiation Comparison Before and After 9-11
Using the NASA website, class members try to determine if changes could be detected in cloud cover, temperature, and/or radiation measurements due to the lack of contrails that resulted from the halt in air traffic after the attacks...
Curated OER
Development Issues in the Northern Suburbs
Students demonstrate the ability to obtain geographic information from a variety of print and electronic sources. They use a variety of maps and data to identify and locate geographical features of Minnesota and Anoka County. in...
Curated OER
Marine Protected Areas
Learners design a research project about a Marine Protected Area they chose. In this marine biology lesson, students gather fish count and catch data then graph them. They create an information poster about their findings.
Curated OER
Creation Mythology
Students construct a map from geographic data and explain relationships found in the information. Students identify ancient beliefs and customs through Hawaiian creation myths while comparing similarities and differences and appreciating...
Curated OER
The Hawaiian Islands
Fourth graders present information of people, places, and environments. They collect, organize, and analyze date to use with these representations.
Curated OER
"Region" Out to Everyone: Geographic Regions Defined
Students define the term region. They collect data about New England after watching a short video. They organize the information into a regional concept map. They draw conclusions based upon their data collection and analysis.
Curated OER
What's Russia To Do?
Students watch a PowerPoint presentation on the Gulag system in Russia. In groups, they use the internet to create maps on climate and population pyramids for the country of Russia. They must use this information and develop a plan to...


