PHET
Band Structure
Electricity travels at the speed of light, 186,000 miles per second. Through a simulation, classes see how the structure of energy bands in crystals of atoms determines how materials conduct electricity. Participants can change the...
PHET
Balancing Act
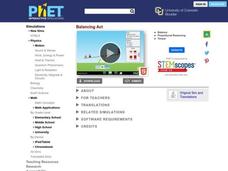
How can a teeter-totter balance when the two people are different sizes? Show classes how this works through a simulation. Scholars play with a teeter-totter to show how different masses and their placement affect balance. Once they have...
PHET
Atomic Interactions
Who knew atoms could be attracted to each other? A simulation allows learners to see how forces between atoms influence the attraction between them. Classes see the attractive and repulsive forces adjusting as distance between atoms...
University of Colorado
The Jovian System: A Scale Model
Jupiter has 67 moons! As the seventh in a series of 22, the exercise shows learners the size and scale of Jupiter and its Galilean moons through a model. They then arrange the model to show how probes orbited and gathered data.
University of Colorado
Great Red Spot Pinwheel
The great red spot on Jupiter is 12,400 miles long and 7,500 miles wide. In this sixth part of a 22-part series, individuals model the rotation of the Great Red Spot on Jupiter. To round out the activity, they discuss their findings as a...
New South Wales Department of Education
The Mangroves
Mangroves are a nursery for a variety salt-water organisms. Learners explore the mangrove ecosystem through audio, video, and/or images, to see the organisms that live in this environment and make food chains pertaining to this...
EngageNY
Games of Chance and Expected Value 1
There's a strong chance that class members enjoy learning math through engaging games. Scholars analyze games of chance to determine long-term behavior. They learn to calculate expected value to help with this assessment.
EngageNY
Estimating Probability Distributions Empirically 2
Develop probability distributions from simulations. Young mathematicians use simulations to collect data. They use the data to draw graphs of probability distributions for the random variable in question.
TryEngineering
Networks
Ever wonder how the Internet works? The lesson teaches scholars the basics of graph theory and how it applies to the Internet. They perform simulations to see how information is sent on the Internet.
PhET
Concentration
When no more solute can be dissolved into a solvent, the solution has reached saturation. The interactive simulation allows learners to manipulate a solution in order to measure its concentration. The amount of solvent, the amount and...
NOAA
Biological Oceanographic Investigations – Through Robot Eyes
How can a robot measure the length of something when we don't know how far the camera is from the object? The lesson explains the concept of perspective and many others. Scholars apply this knowledge to judge the length of fish and the...
PhET
Neuron
Neurons send electrical signals throughout a body based on chemical communication. Individuals stimulate a neuron to see the effects. They notice the sodium-potassium channels along with ions, concentrations, and a membrane potential...
PhET
Rutherford Scattering
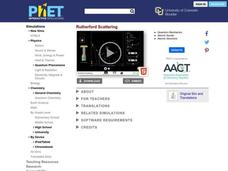
Rutherford performed his famous experiment in 1907 with Marsden, showing the true atomic structure. This interactive simulation compares Rutherford's historical experiment to the Plum pudding model of the atom. In both models, alpha...
PhET
Molarity
All chemists know that moles are made of molecules. Individuals see how changes in the amount of solute affect the concentration of the solutions. By manipulating solute amounts (moles), solution volume (liters), and solute types, the...
PhET
Balloons and Static Electricity
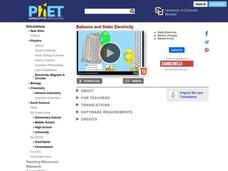
Like all electricity, static electricity flows at the speed of light, or 186,282 miles/second. The interactive simulation shows how like charges repel like charges and opposites attract. The user can choose either one or two balloons, a...
NOAA
Ocean Zones
How can organisms light up in water? Bioluminescence is light produced in a chemical reaction that can occur in an organism's body. First, learners determine what happens to light/color as you move into the deep ocean. In groups, they...
Polar Trec
Bering Sea Fabulous Food Chain Game
In spring, the Bering Sea turns green due to phytoplankton, which live at the surface, experiencing a population explosion. Groups of scholars play a food chain game, writing down food chains as the game is played. After five to six...
Polar Trec
Arctic Smorgasbord!
Two blooms of phytoplankton, instead of just one, now occur in the Arctic due to declining sea ice, which will have widespread effects on the marine life and climate. In small groups, participants build an Arctic food web with given...
TryEngineering
Exploring at the Nanoscale
Discover a world too small to see. In the lesson, young scientists learn about nanotechnology and brainstorm ideas for new applications of it. They perform an activity to determine how surface area changes when objects are made smaller...
NOAA
Biological Oceanographic Investigations – Signals from the Deep
The Deepwater Horizon oil spill directly impacted an area of the Gulf of Mexico the size of Oklahoma. A marine biology lesson looks at the impact of an oil spill on the deeper parts of the ocean. Scholars download actual data collected...
Polar Trec
Polar Detectives: Using Ice Core Data to Decode Past Climate Mysteries
How does examining an ice core tell us about weather? Learners set up and explore fake ice cores made of sugar, salt, and ash to represent historical snowfall and volcanic eruptions. From their setups, scholars determine what caused the...
Bowland
Fashionista
So trendy! Show your class how to identify trends in sales patterns using mathematics. Scholars use a software simulation to collect data on age groups, price, and sales at a fashion store. This data allows individuals to determine the...
Bowland
Crash Test
Use mathematics and simulations to investigate car crashes. IScholars test hypotheses involving car crashes. They collect, analyze, and display data from computer simulations to support or refute their hypotheses.
Rochester Institue of Technology
Patient Flow
It's time to redesign the healthcare system. The seventh installment of a 9-part technology/engineering series teaches future engineers about patient flow and how to design healthcare centers to improve flow. Classroom simulations allow...


