Math Worksheets Land
Halloween Interpreting Pictograph
The best part about Halloween is the candy. Individuals read a pictograph that depicts the amount of candy five children received. Then, they respond to five questions using the picture graph to support their answers.
Mathed Up!
Pictograms
Young mathematicians read, interpret, and complete a variety of real-world pictograms. Each question includes a key and information to complete the graphs.
E-learning for Kids
E Learning for Kids: Math: Orange Trees, Olive Trees: Data and Capacity
In this lesson, students collect data related to a question, compare and order the capacity of containers, and interpret picture graphs.
Khan Academy
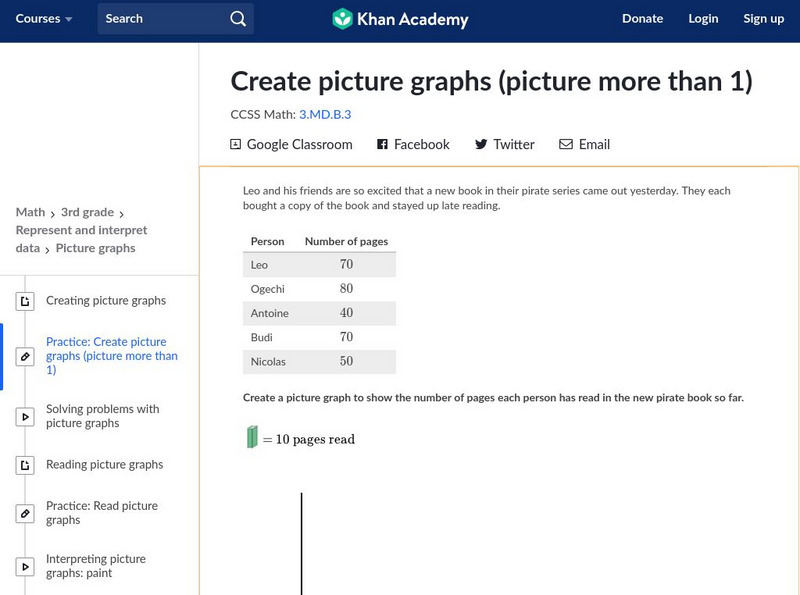
Khan Academy: Create Picture Graphs (Picture More Than 1)
Create and interpret picture graphs. Students receive immediate feedback and have the opportunity to try questions repeatedly, watch a video tutorial, or receive hints about how to create picture graphs. CCSS.Math.Content.3.MD.B.3 Draw a...
Khan Academy
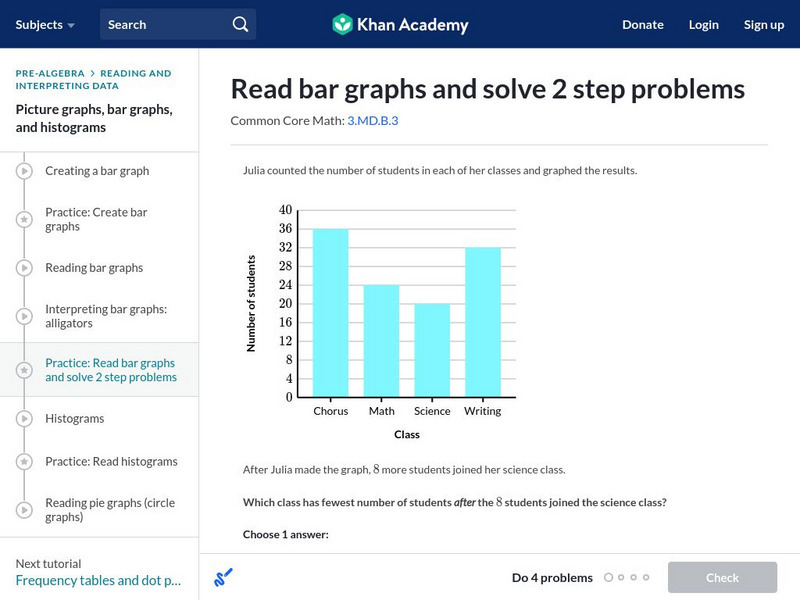
Khan Academy: Read Bar Graphs and Solve 2 Step Problems
Read and interpret a double bar graphs. Students receive immediate feedback and have the opportunity to try questions repeatedly, watch a video or receive hints. CCSS.Math.Content.3.MD.B.3 Draw a scaled picture graph and a scaled bar...
E-learning for Kids
E Learning for Kids: Math: Treasure Island: Interpreting Data
Students will play interactive games to interpret information from different types of graphs.


