Curriculum Corner
Earth Day Grid Math
Get into springtime with a festive practice sheet designed to test scholars' knowledge of grids. Learners locate items such as watering cans, snails, and flowers following the x and y-axis. Worksheet themes include Earth Day, gardening,...
EngageNY
Computing Actual Lengths from a Scale Drawing
The original drawing is eight units — how big is the scale drawing? Classmates determine the scale percent between a scale drawing and an object to calculate the length of a portion of the object. They use the percent equation to find...
EngageNY
Solving Area Problems Using Scale Drawings
Calculate the areas of scale drawings until a more efficient method emerges. Pupils find the relationship between the scale factor of a scale drawing and the scale of the areas. They determine the scale of the areas is the square of the...
EngageNY
Drawing the Coordinate Plane and Points on the Plane
To plot a point in the coordinate plane, you first need a coordinate plane. Pupils learn to draw an appropriate set of axes with labels on a coordinate plane. They must also determine a reasonable scale to plot given coordinate pairs on...
EngageNY
Modeling Linear Relationships
Math modeling is made easy with the first installment of a 16-part module that teaches pupils to model real-world situations as linear relationships. They create graphs, tables of values, and equations given verbal descriptions.
Georgia Department of Education
Math Class
Young analysts use real (provided) data from a class's test scores to practice using statistical tools. Not only do learners calculate measures of center and spread (including mean, median, deviation, and IQ range), but...
Curated OER
Reflecting a Rectangle Over a Diagonal
Use the handout as guided or independent practice in drawing a reflection of a rectangle over a line. Three rectangles are provided for practice in addition to a critical thinking question.
Mathed Up!
Nets, Plans, and Elevations
A dimensional resource teaches viewers to recognize 2-D views of 3-D objects and how to match nets with their 3-D figures. Individuals draw different views of three-dimensional objects including views from the front, side...
World Wildlife Fund
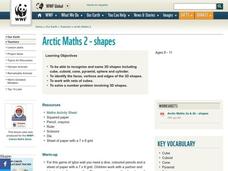
Shapes
Investigate the properties of three-dimensional figures with this Arctic-themed math lesson plan. Beginning with a class discussion about different types of solid figures present in the classroom, young mathematicians are then given a...
National Security Agency
Awesome Area - Geometry and Measurement
Break out those math manipulatives, it's time to teach about area! Capturing the engagement of young mathematicians, this three-lesson series supports children with learning how to measure the area of squares, rectangles, and other...
Inside Mathematics
Vencent's Graphs
I like algebra, but graphing is where I draw the line! Worksheet includes three multiple-part questions on interpreting and drawing line graphs. It focuses on the abstract where neither axis has numbers written in, though both are...
Noyce Foundation
Granny’s Balloon Trip
Take flight with a fun activity focused on graphing data on a coordinate plane. As learners study the data for Granny's hot-air balloon trip, including the time of day and the distance of the balloon from the ground, they practice...
CCSS Math Activities
Vincent’s Graphs
What in the world are they doing? Given two graphs, scholars interpret the graphs and connect them to a real-world situation. They must also draw a graph given information about a context.
Mathed Up!
2D and 3D Shapes
What a great assessment to give young mathematicians in order to test their knowledge on two- and three-dimensional shapes. Learners name various shapes, identify the number of edges, faces, and vertices, match an unfolded version of a...
Mathwire
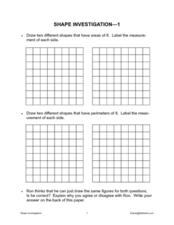
Shape Investigation: Area and Perimeter
Does a shape's perimeter always match its area? Learners approach this and other claims in this shape investigation worksheet. Using blank grids, they draw various shapes based on required perimeter and area measurements, labelling the...
Mathematics Vision Project
Module 6: Congruence, Construction, and Proof
Trace the links between a variety of math concepts in this far-reaching unit. Ideas that seem very different on the outset (like the distance formula and rigid transformations) come together in very natural and logical ways. This...
Illustrative Mathematics
Security Camera
A different-than-normal problem that allows learners to practice their reasoning to find an answer. The problem bases itself off a graph drawing of a store that needs to install security cameras. The challenge is to find which placement...
Mathematics Assessment Project
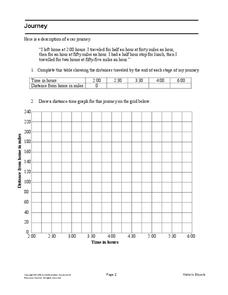
Journey
Drive home math concepts with an engaging task. Learners follow a verbal description to fill in a table and create a distance-time graph representing a car journey. They then answer questions by interpreting the graph.
Mathed Up!
Cumulative Frequency and Box Plots
Learn how to display data. Young data analysts watch a video to review how to create cumulative frequency histograms and box plots. They work on a set of questions to practice producing these data displays.
Inside Mathematics
Functions
A function is like a machine that has an input and an output. Challenge scholars to look at the eight given points and determine the two functions that would fit four of the points each — one is linear and the other non-linear. The...
Corbett Maths
Enlargements Using Ray Method
Figure out what to do when there is no grid to count. Using a ruler and a sharp pencil, the narrator shows how to perform a dilation when the figure is not on a grid. The ray method works by drawing a ray from the center of dilation...
Noyce Foundation
Pizza Crusts
Enough stuffed crust to go around. Pupils calculate the area and perimeter of a variety of pizza shapes, including rectangular and circular. Individuals design rectangular pizzas with a given area to maximize the amount of crust and do...
Radford University
What’s Your Party Like? An Exploration of Area
Who knew that a party is all about the area. Individuals draw out a patio on grid paper while planning to host a party. Using colored paper to represent the total area of the patio, learners cut out furnishings to add to the patio,...
Curated OER
Shapes and Their Insides
Learners follow a series of instructions for drawing and coloring different shapes in order to learn the difference between the perimeter and area of a polygon. Then they are asked to find the perimeter and area of a 3x4 rectangular...


