Curated OER
Weather
Students create a spreadsheet and chart using data collected. In this weather lesson, students select five cities from their state, including the city they live in. Students take daily temperature readings from all five cities. ...
Curated OER
A Wet Welcome Home
Students investigate data collection and analysis. In this Algebra I lesson plan, students create a scatter plot and find the equation of best fit in a simulation of a leaking water pipe.
Curated OER
A Tall Story
Students investigate the growth rate of a man named Bob Wadlow. In this growth rate of a man lesson, students determine if the growth rate of this particular man was normal or abnormal. Students bring in data of their height over time...
Curated OER
What Are Erosion and Sediments?
Students create experiments in class based on the erosion of Earth. In this erosion lesson, students perform a lab in class replicating the effects of erosion. Students finally draw their own conclusions based on the research performed.
Alabama Learning Exchange
Poppin' For Popcorn!
Students graph data from different popcorn flavors. In this graphing lesson, students make graphs using an assigned web site after collecting data about the flavors of popcorn that fellow classmates prefer.
Alabama Learning Exchange
Keep It Movin'!
Learners conduct an experiment to study friction. They complete a KWL chart on friction and conduct an activity about the amount of friction on a moving object. To conclude, pupils create a table or graph of the data collected and they...
Curated OER
Data! Data! Graph that Data!
Fifth graders create data graphs using Microsoft Excel. In this data collection instructional activity, 5th graders create and conduct a survey, then use Excel to organize and graph their data.
Curated OER
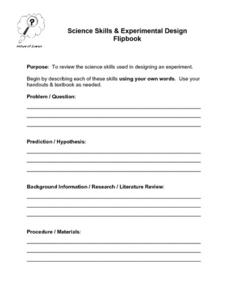
Science Skills and Experimental Design
In this experimental design worksheet, students describe the different science skills required when designing an experiment. Then students create a flipbook with the information. This worksheet has 9 short answer questions.
Curated OER
TV Survey - Data Collection and Analysis
In this data collection and analysis worksheet, 4th graders complete a tally chart about the number of hours that fourth graders watch television. They create a bar graph with the information, write a paragraph about the survey results,...
Curated OER
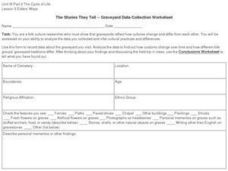
The Stories They Tell -- Graveyard Data Collection Worksheet
In this folk culture research worksheet, students use the form to record data about a graveyard that they visit to show that graveyards reflect how cultures change and differ from each other.
Curated OER
Learning to Interview
Second graders watch simulated interview between the teacher and a student before they interview a classmate using the form provided. Next, they complete two interviews of family members at home. They focus on the concepts of ancestors...
Curated OER
Get Your Numbers in Shape - TI-83
High Schoolers use the TI-83 calculator to produce a sequence, explore patterns and find a linear or quadratic equation for a given pattern. They use inductive reasoning to make conjectures about patterns. They find the Y-value of a...
Curated OER
How Much Water Is Available In The Atmosphere For Precipitation?
Students explore the relationship between the available water in the atmosphere and how it is portrayed on satellites. After examining global moisture and precipitation students research precipitation data graph the results. Using their...
Curated OER
Grade 1: More Land or Water?
First graders listen as the teacher reads a story involving cross-continent traveling. Students collect a random sample by tossing an inflatable globe and recording whether they touch land or water each time they catch the globe in order...
Curated OER
Creating a Graph
Students brainstorm favorite things to do during the summer. They survey classmates to collect data, arrange it in a chart, and create graphs using ClarisWorks.
Curated OER
Measurement and Data Collecting using Image Processing
Learners trace the route of the historical event and measure the distance over which the people involved journeyed. A data sheet be constructed outlining the location of events, and the speed with which the journey occurred.
Curated OER
Great Graphing
Students collect data, use a computer spreadsheet program to create various graphs, and compare the graphs. They state the findings of each graph in writing and decide which graph type best represents the data.
Curated OER
The Internet Pizza Server - Creating Your Own Pizza
Students create their own pizza, "order" it from the Internet, and see digitized versions. They calculate the area of various size pizzas in order to do cost analysis to determine best buys.
Curated OER
Osmosis and the Cell Membrane-part 2
Young scholars participate in a review of diffusion and the basic properties of the cell membrane before exploring the process of osmosis in a lab activity. Using shell-less eggs that have soaked in various solutions, students make...
Curated OER
Biospheres in Your Backyard
Students collect data from a local river biome. They use the information for metric conversion and graphing equations. They study the components of what makes up a biosphere and how math is used to analyze one.
Curated OER
Microsoft Access Lesson Plan
Third graders read children's literature during the school year and compile a list of books and genres in an Access database. They print out a report of all the different books and genres of they read over the whole school year.
Curated OER
The Write Stuff
Fourth graders share a previously written portfolio piece and the class guesses the genre. Students use tally marks to keep track of how many of each piece there are in class. Once the data collection is complete, 4th graders create a...
Curated OER
Kindergarten Class Favorites
Students discuss their favorite foods, a list of four favorite food are compiled on the board or a chart. They each vote for their favorite food and the data is entered onto a spread sheet and a graph is created while the students watch...
Curated OER
Data Collection Graph
To be used however fits your needs most, this data collection graph includes spaces to chart a years worth of data. Print, keep handy, and fill out as the target skill is performed.


