Science Education Resource Center at Carleton College
Serc: Investigating South Crow River: Discharge, Turbidity, Erosion, Sediments
In this field investigation, small groups of students will observe and measure characteristics of the South Crow River near Mayer, Minnesota. Data collection on these characteristics will include but not be limited to: speed of current...
Science Education Resource Center at Carleton College
Serc: Investigating the Minnesota River's Glacial History Near Henderson, Mn.
While visiting three separate sites in or near the Minnesota River valley, students will question the deposition environment of rock types found and the creation of the valley itself. Students will discover find types of rock found far...
Harvard University
Harvard Smithsonian: Everyday Classroom Tools
The focus of this series of lessons is to engage students in an exploration of the world around them. The emphasis is on inquiry as students learn about the earth, sun, light, shapes and more.
Texas A&M University
Ocean World: Bringing the Ocean to the Classroom
Online resource for students and teachers to see information on icebergs, fisheries, coral reefs, waves, currents and more. Provides teachers with learning activities. Has its own ask-an-expert site (Ask Dr. Bob), and provides real-time...
Science Education Resource Center at Carleton College
Serc: Mn Step: Stream Study: Assessing the Relative Health of Streams
Students will collect invertebrate samples from three different streams using nets and kick-seines. They then identify what they have found and add the information to the whole class data. Afterward, students propose a new question about...
Science Education Resource Center at Carleton College
Serc: Mn Step: Water Retention No Problem With the Key Investigation
Students go outside to a nearby pond or wet area, and collect vertebrates and invertebrates. These are identified using a classification key. Information is recorded using a digital camera and a science notebook. Students later prepare a...
Science Education Resource Center at Carleton College
Serc: Mn Step: Snails: Population Calculation in an Aquatic Environment
A 3-day field investigation where learners visit an aquatic area and collect snails. These are examined, the species identified, and the body parts and characteristics studied and recorded. Then the snails are returned to their homes....
Other
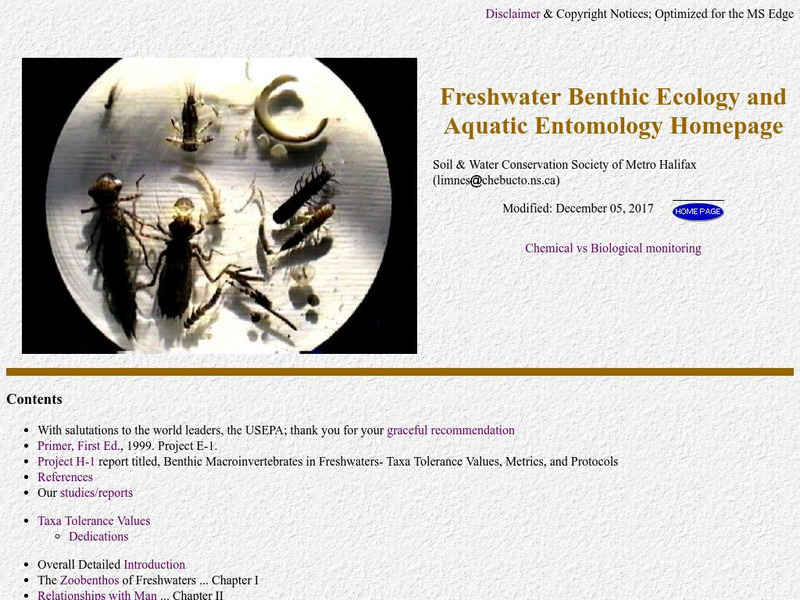
Freshwater Ecology
This is a comprehensive and detailed site providing information on aquatic macroinvertebrates. The emphasis is on biomonitoring of water quality through quantitative assessment of numbers and types of small aquatic organisms.
Other
The Dirty Dozen Persistent Organic Pollutants
Use this site to learn about the effects of persistent organic pollutants on the ecology of Antarctic coastal waters. Information is presented for both teacher and student researcher.
Other
Rutgers Marine & Coastal Sciences: Cool Classroom
Students and teachers can explore the work of marine scientists and observe the ocean from their computers. Learn about Rutgers Coastal Ocean Observation Laboratory, discover why oceanography is important, and see what life is like in...
Oak Ridge National Laboratory
Oak Ridge National Laboratory: Field Investigation Source Platform
This site from the Oak Ridge National Laboratory gives a description of field investigation and then provides a detailed break-out of each step in the process.
Science Education Resource Center at Carleton College
Serc: Mn Step: Who Wants to Live Here? Water Sampling at Local Pond and Stream
The water quality at a local pond or stream is tested, and examined for organisms. Students record their data and observations and analyze the information. A pH chart showing what aquatic organisms can live at different pH levels is...


