Illustrative Mathematics
Illustrative Mathematics: F Bf Summer Intern
For this task, students write expressions that describe the relationship between quantities and ketch and analyze its graph. The task is about a worker at an aquarium who must dilute saltwater to a specified concentration of salt. Aligns...
Illustrative Mathematics
Illustrative Mathematics: F Bf Medieval Archer
In this task about archery, students investigate the effects on a function of replacing f(x) with f(x+k). Aligns with F-BF.B.3.
Illustrative Mathematics
Illustrative Mathematics: F Bf Temperature Conversions
In this task involving temperature conversions, students compose and solve functions. Unit conversion problems provide a rich source of examples for the composition of functions and for inverses. Aligns with F-BF.A.1.c and F-BF.B.4.a.
Illustrative Mathematics
Illustrative Mathematics: N q.a.1: How Much Is a Penny Worth?
Students will determine the "real worth" of a penny by analyzing the present worth of the various metals that are used to compose the penny. Aligns with N-Q.A.1.
Illustrative Mathematics
Illustrative Mathematics: 8.f Riding by the Library
In this task, 8th graders draw the graphs of two functions from verbal descriptions. Both functions describe the same situation but changing the viewpoint of the observer changes where the function has output value zero. This forces the...
Illustrative Mathematics
Illustrative Mathematics: 8.f Bike Race
Eighth graders are presented with the distance-time graphs of two bike riders in a race. They are to identify the winner and write a story describing what is happening during the race based on the shapes of the graphs. Aligns with 8.F.B.5.
Illustrative Mathematics
Illustrative Mathematics: 8.f Distance
Eighth graders are presented with the graphs of two cars traveling. One shows distance from home versus time and the other shows speed versus time. Students are to write a description of what might be happening during each car's...
Illustrative Mathematics
Illustrative Mathematics: 8.f Tides
In this problem, 8th graders are presented with a graph showing high and low tides and are asked to analyze it. Aligns with 8.F.B.5.
Illustrative Mathematics
Illustrative Mathematics: 8.f Heart Rate Monitoring
In this task, 8th graders are asked to draw a graph that represents heart rate as a function of time from a verbal description of that function. Then they use the graph to draw conclusions about the context. Aligns with 8.F.B.
Illustrative Mathematics
Illustrative Mathematics: 8.f Us Garbage, Version 1
Eighth graders work with input values (the year) and output values (the amount of garbage that year) in a table about the garbage produced in the US. They study the table to answer specific questions, state whether it represents a linear...
Illustrative Mathematics
Illustrative Mathematics: 8.ee Who Has the Best Job?
This problem asks students to compare the incomes for two different jobs, draw their graphs, and explain whether the graphs alone would show who makes the most per hour. Aligns with 8.EE.B.5.
Education Place
Houghton Mifflin: Eduplace: Functions and Graphing
An overview of functions and graphing on a coordinate plane.
Purple Math
Purplemath: Graphing Overview: Straight Lines
This resource provides an overview of graphing for various types of functions, instruction on graphing straight lines and also, includes advice on common mistakes made by students.
CK-12 Foundation
Ck 12: Analysis: Graphs of Polynomials Using Zeros
[Free Registration/Login may be required to access all resource tools.] In this lesson students use ''X'' and ''Y'' intercepts to graph polynomials of 3rd degree or higher. Students examine guided notes, review guided practice, watch...
Khan Academy
Khan Academy: Interpret Equations Graphically
Practice the connection between the graphical representation of equations and their algebraic solutions. Students receive immediate feedback and have the opportunity to try questions repeatedly, watch a video, or receive hints.
Khan Academy
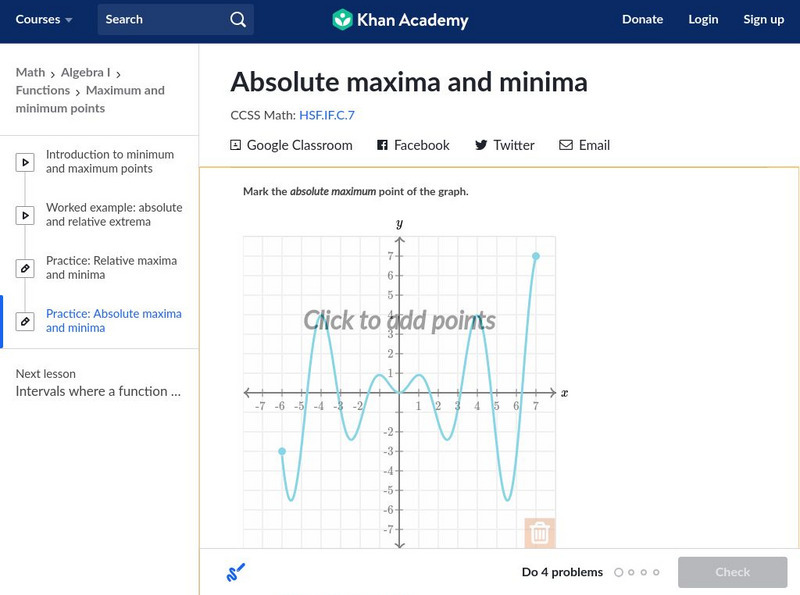
Khan Academy: Absolute Maxima and Minima
Given the graph of a function, find its absolute maximum and minimum points. Students receive immediate feedback and have the opportunity to try questions repeatedly, watch a video or receive hints.
Khan Academy
Khan Academy: Graph Absolute Value Functions
Graph absolute value functions like f(x)=|x+3|+2. Students receive immediate feedback and have the opportunity to try questions repeatedly, watch a video or receive hints.
Khan Academy
Khan Academy: Average Rate of Change: Graphs and Tables
Find a function's average rate of change over a specific interval, given the function's graph or a table of values. Students receive immediate feedback and have the opportunity to try questions repeatedly or receive hints.
Khan Academy
Khan Academy: Average Rate of Change Word Problems
Find and represent the average rate of change of a real-world relationship. Students receive immediate feedback and have the opportunity to try questions repeatedly or receive hints.
Khan Academy
Khan Academy: Average Rate of Change
Find the average rate of change of a function over a given interval. Students receive immediate feedback and have the opportunity to try questions repeatedly, watch a video or receive hints.
Khan Academy
Khan Academy: Periodicity of Algebraic Models
Given the graph that models a real-world context, answer a question about the periodicity of the graph. Students receive immediate feedback and have the opportunity to try questions repeatedly, watch a video or receive hints.
Khan Academy
Khan Academy: Graph Interpretation Word Problems
Match features of graphs of modeling functions to their real-world meaning. Students receive immediate feedback and have the opportunity to try questions repeatedly, watch a video or receive hints.
Khan Academy
Khan Academy: End Behavior of Algebraic Models
Given a graph that models a real world context, answer a question about the end behavior of the graph. Students receive immediate feedback and have the opportunity to try questions repeatedly, watch a video or receive hints.
Khan Academy
Khan Academy: Function Inputs & Outputs: Graph
Find all the inputs that correspond to a given function output, using the function's graph. Students receive immediate feedback and have the opportunity to try questions repeatedly, watch a video or receive hints.


