Math Is Fun
Math Is Fun: Investment/loan Graph
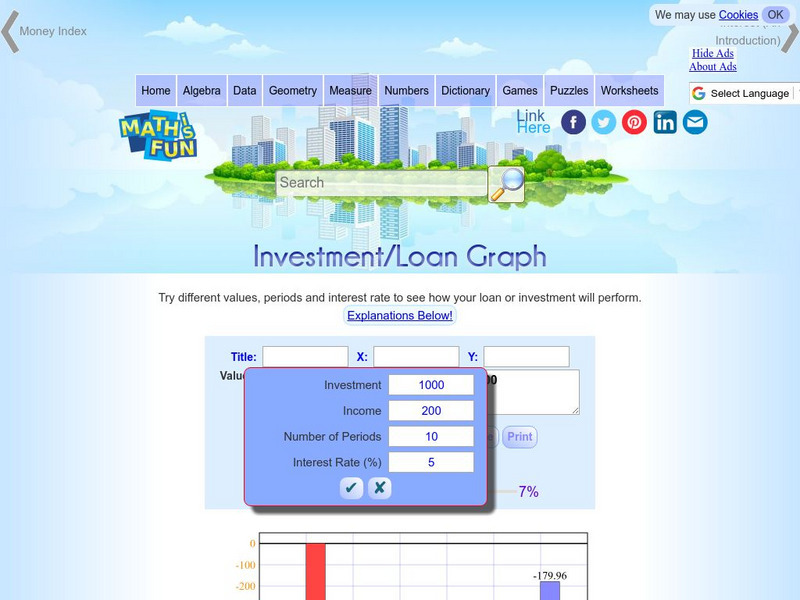
This interactive graph lets you explore how a loan or investment performs in different scenarios. Adjust the present value, the net present value, the loan or investment amount, the length of time, and the interest rate, and see the data...


