Curated by
ACT
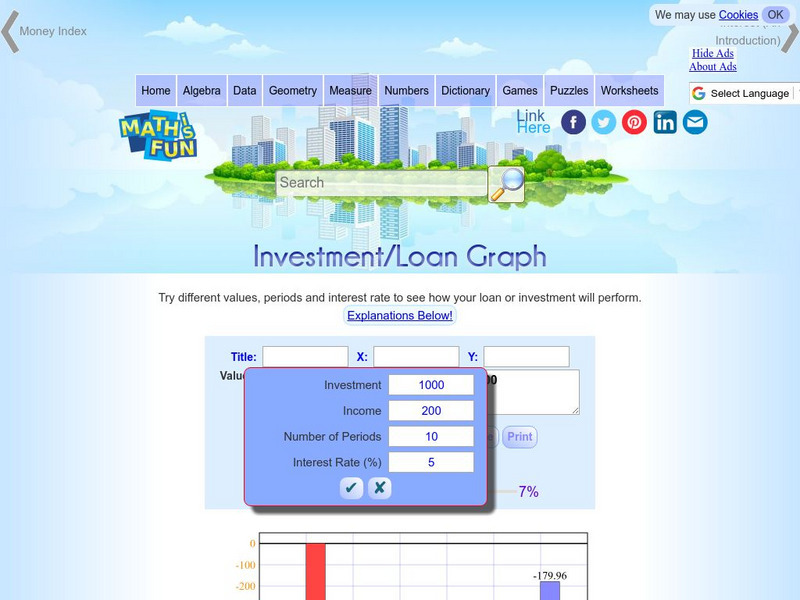
This interactive graph lets you explore how a loan or investment performs in different scenarios. Adjust the present value, the net present value, the loan or investment amount, the length of time, and the interest rate, and see the data as a table or a graph. Includes a clear explanation of terms.
3 Views
0 Downloads
Concepts
Additional Tags
Classroom Considerations
- Knovation Readability Score: 3 (1 low difficulty, 5 high difficulty)
- The intended use for this resource is Instructional|practice

