Curated OER
Introduction to Representing and Analyzing Data
Represent data graphically. Allow your class to explore different methods of representing data. They create foldables, sing songs, and play a dice game to reinforce the measures of central tendency.
Illustrative Mathematics
Writing Constraints
Use this resource to present your number crunchers with how to write a constraint equation and to determine viable solutions. The price of an object limits the amount that can be purchased. The speed at which you walk limits the number...
Curated OER
"All Together Now" by Barbara Jordan
Cover the topic of race relations with these questions that go with Barbara Jordan's persuasive speech "All Together Now." These reading questions ask readers to think about her speech in a variety of ways by analyzing particular words...
Curated OER
"Monsters Are Due on Maple Street" by Rod Serling
These questions ask learners to think about the text "Monsters Are Due on Maple Street" in a variety of ways. In addition to practicing reading comprehension, class members work on interpreting, making inferences and connections,...
Curated OER
What's in a Graph?
Students explore how to use and interpret graphs. The graphs are pulled from a variety of sources, and the activities ask students to interpret graphs. They start this lesson with knowledge of what a graph is. Students also know how to...
Curated OER
Modernism in Poetry, Painting, and Music
Are you teaching Modernism to your class? Connect different areas of artistic expression in the Modernist Era. Learners read T.S. Eliot, view art by Pablo Picasso, and listen to a Modernist musical composition. This final assignment is...
Curated OER
Considering Media And Meanings
Students study reproductions of prints or murals. They interpret artworks supporting their conclusions with evidence in work and from contextual information. They focus especially on significance of artist's choice of mural or...
Curated OER
Gummy Bear Picture Graph
First graders investigate picture graphs. In this graphing instructional activity, 1st graders create a picture graph with the x-axis being number and the y-axis being color. Students sort their gummy bears by color and use pictures of...
Curated OER
Putting the World in Perspective
Students work in small groups to: make a mental map of the world by tearing paper shapes of the seven continents and locating them on a flat surface in their relative positions, compare their finished mental map to a reference world map,...
Curated OER
Archaeologists Puzzle Pieces
Learners identify how archaeologists use typology to interpret artifacts. They interpret sample artifacts as if they discovered them.
Curated OER
Conducting a Scientific Investigation
Students investigate a possible health problem in the local school district through inquiry into attendance records, activities, maps, graphs, and data tables. The simulation continues as solutions for the problem are sought.
Curated OER
Munsch mania
Third graders choose a Robert Munsch poem to interpret. In this language arts lesson plan, 3rd graders interpret their chosen poem by either acting it out or through illustrations. Once the interpretations are complete, students send...
Curated OER
Show Me!
Students analyze and interpret graphs. In this graphing lesson, students view a video and construct their own graphs (line, circle, bar) from given sets of data.
Curated OER
Famous Quote Interpretation
In this quote interpretation instructional activity, students use critical thinking skills to respond to a question regarding a passage by Ralph Waldo Emerson.
Curated OER
Organizing and Interpreting Data
In this organizing and interpreting data activity, learners solve and complete 10 different problems related to reading various data tables. First, they complete the 3 charts shown with the correct tally amount, frequency amount, and...
Curated OER
Understanding Chemical Hazard Labels and MSDS
In this chemical hazard labels and MSDS worksheet, students read and interpret chemical hazard labels and MSDS. Then they use the documents given to respond to several questions about chemical hazard labels. Students identify the...
Curated OER
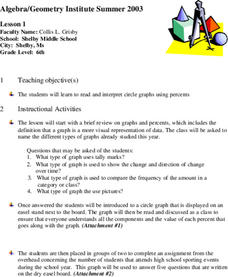
Circle Graphs
Sixth graders participate in a lesson that covers the reading and interpretation of a circle graph. They review the part of a whole concept for percents and student observe and practice using the circle graph.
Curated OER
Ocean Botttom Profile
Students interpret a graph of ocean depths and topographic features. This task assesses students' abilities to interpret figures, organize and represent data, apply knowledge of scale to a profile, and apply theoretical knowledge.
Curated OER
The Blizzard of 1993
Students read and interpret the information from a barograph from a major winter storm. This task assesses students' abilities to interpret and analyze graphs, construct data tables and graphs, generalize, infer, apply knowledge of...
Curated OER
A Fiedl Study of an Integral Species
Young scholars compile baseline population information on a local species. They design and conduct a scientific investigation of a local species. Students interpret, analyze and communicate results based on sound scientific and...
Curated OER
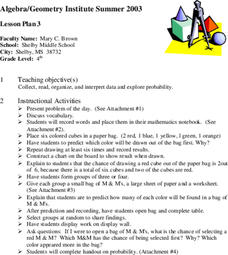
Exploring Probability
Fourth graders participate in a lesson that explores probability. They use candy and model cubes to experiment with different outcomes that can be charted if the students can proceed to the objective of the lesson. They discover how...
Curated OER
How to "read" a painting
Students follow a structured method of critiquing an art work to discover its substance and meaning. They apply four distinct steps to critique a painting which are: describe, analyze, interpret, and judgment.
Curated OER
Quick-Sketch Artist Tips on Mind Mapping the Urban Landscape
Students interpret maps. They also create mental maps of regions in which they are studying. Students then explain the historical or cultural significance of map features orally or in written form. Students take a walking field trip...
TED Talks
Ted: Ted Ed: Speech Acts: Constative and Performative
When are words just words, and when do words force action? Linguist J.L. Austin divided words into two categories: constatives (words that describe a situation) and performatives (words that incite action). For instance, is a "No...


