Cyberbee
Cyberbee: Who Dunnit?
If you are a crime scene investigation (CSI) fan, then you will love this site! You get to be the detective by examining the evidence, viewing the crime scene, dusting for fingerprints, interviewing the suspects, and solving the crime.
PBS
Pbs Learning Media: A Different Kind of Fuel
In this segment from Curious, learn about creating energy from solar rays to meet the growing energy needs of the world. [6:09]
Beacon Learning Center
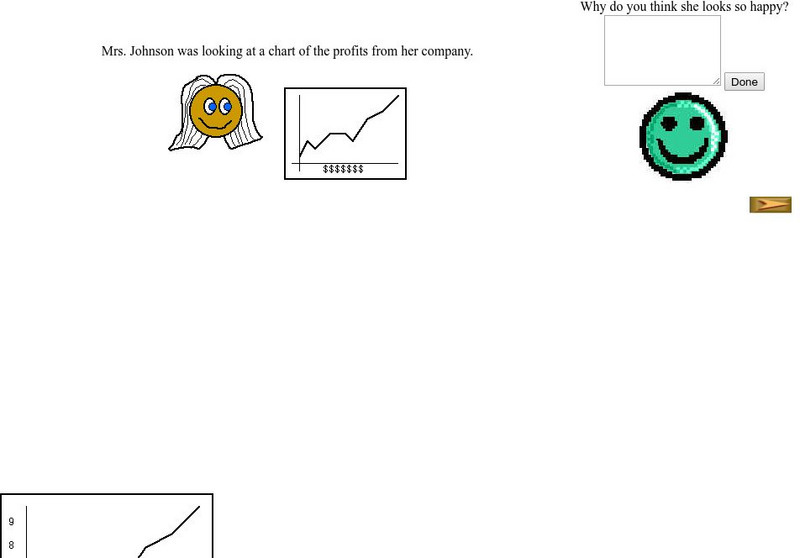
Beacon Learning Center: Interpreting Line Graphs
This site is a lesson on creating and interpreting a line graph. It explains how a line graph is created and then asks questions about what is learned from the data. Students type in open responses, and answers and feedback follow.
Beacon Learning Center
Beacon Learning Center: Piece of Pie
This is a tutorial for creating and practice interpreting pie charts. They use the example of number of people in each of 24 families to demonstrate how the pieces of pie are created. Then questions were asked and students input the...
Beacon Learning Center
Beacon Learning Center: Push Ups
This is a tutorial on line graphs including when, how, and why one might choose to use them and how to interpret the data when it is complete. This one is to reach a goal for the number of push ups needed to win the Presidential Fitness...
Other
George W. Bush Library: What Do Historical Objects Tell Me? [Pdf]
A comprehensive lesson training learners to analyze historical objects to determine features, reliability, authenticity, and provenance through observation skills encouraged through a variety of activities.
McGraw Hill
Glencoe: Self Check Quizzes 2 Making Predictions
Use Glencoe's Math Course 2 randomly generated self-checking quiz to test your knowledge of using data to make predictions. Each question has a "Hint" link to help. Choose the correct answer for each problem. At the bottom of the page...
McGraw Hill
Glencoe: Self Check Quizzes 2 Using Statistics to Predict
Use Glencoe's Math Course 2 randomly generated self-checking quiz to test your knowledge of using statistics to predict. Each question has a "Hint" link to help. Choose the correct answer for each problem. At the bottom of the page click...
Texas Education Agency
Texas Gateway: Predicting, Finding, and Justifying Data From a Table
Given data in table form, the student will use the data table to interpret solutions to problems.
Annenberg Foundation
Annenberg Learner: Interactives: Cast Your Vote!
Upper elementary, middle, and high school students can use this exhibit to get an understanding of how polls and elections are conducted. The discussion includes random samples, margins of error, and other concepts related to statistics.
National Council of Teachers of Mathematics
The Math Forum: Exploring Ocean Data Lesson Plan
Find "oceans of data" for students of all ages. NCTM, California, and Philadelphia standards are listed for each grade level along with lesson plans and other website resources.
Oswego City School District
Regents Exam Prep Center: Displaying Data
Use this lesson, practice exercise, and teacher resource in planning instruction on displaying data. In the lessons, you'll find definitions and examples of ways to collect and organize data, quartiles, and box-and-whisker plots, as well...
Gilder Lehrman Institute of American History
Gilder Lehrman Institute: History Now: Enslaved African Americans and Expressions of Freedom
[Free Registration/Login Required] Students will examine African American slave spirituals, a painting, and a personal narrative to analyze the underlying messages of these materials.
Center for Innovation in Engineering and Science Education, Stevens Institute of Technology
Ciese: Collaborative Projects
Using a variety of science topics, these projects link your class with classes around the world in data collection and analysis. There are projects recommended for all grade levels. Begin dates and end dates are listed to help in...
Other
Statistics Canada: Add! Don?t Subtract! A Complete Count
In this learning activity from Statistics Canada, students will learn the value of census data when it is totaled and linked with different geographic regions. As part of this lesson, students will work with a neighbourhood map and...
Education Development Center
Math Partners: Statistics and Probability [Pdf]
Comprehensive unit that consists of lessons and activities designed to help students learn statistics and probability concepts.
BBC
Bbc: Ks2 Bitesize: Interpreting Data Quiz
This site offers a 10 question, printable quiz on interpreting data. It also offers links to games and information about interpreting data.
Government of Alberta
Learn Alberta: Math Interactives: Exploring Election Data
Using actual Alberta provincial election results, students have the opportunity to interpret election data using a variety of graph types. Pictographs, line graphs, bar graphs, circle graphs, and data tables are covered in this...
Government of Alberta
Learn Alberta: Math Interactives: Exploring Data Display and Graphs
This multimedia Learn Alberta math resource focuses on graphing data. In the video portion, students will see how math is involved in the display of merchandise in stores. The accompanying interactive component provides an exploration...
Texas Education Agency
Texas Gateway: Evaluating Data in Tables, Graphs and Charts
[Accessible by TX Educators. Free Registration/Login Required] In this lesson students look at examples of graphics, tables, charts, and graphs, and learn how to interpret their data. They will be able to use this skill to enhance their...
Education.com
Education.com: 1.md.c.4 Worksheets
[Free Registration/Login Required] These worksheets can help students practice organizing, representing, and interpreting data with up to three categories. Choose from among 25 worksheets based on your student's needs.
Other
Ocean Tracks: Fact or Artifact? Interpreting Patterns in Ocean Tracks Data [Pdf]
Ever wonder where marine animals go? How fast they swim? How deep they dive? Electronic tagging has opened a new window into the world of the open ocean. Ocean Tracks gives you access to data collected by tags on real live migrating...
PBS
Pbs Kids Afterschool Adventure!: Operation: Data Saves the Day Activity Plan
Data comes to the rescue! Children will collect, analyze, and represent data as they try to dodge a series of catastrophes faced by characters from their favorite PBS Kids shows.
PBS
Pbs Kids Afterschool Adventure!: Operation: Martha's Stem Stories Activity Plan
Welcome to Martha's STEM Stories! STEM stands for science, technology, engineering, and mathematics. You may already know that doing STEM means testing ideas, collecting data, making calculations, and drawing graphs and charts-but you...


