Curated OER
Residential Power System
Perform data analysis on energy consumption to apply algebraic expressions to the real world. Learners will write and solve equations that answer various questions from residential power use. They will collect data at home and calculate...
Curated OER
The Barbie Bungee Drop
What do math, bungee jumping, and Barbie® have in common? Young adventure seekers use rubber bands as bungee cords to predict a thrilling, but safe, jump for their doll. First, test jumps are conducted with a few rubber bands. Then more...
Curated OER
Barbie Bungee
Middle and high schoolers collect and analyze their data. For this statistics lesson, pupils analyze graphs for linear regression as they discuss the relationship of the function to the number of rubber bands and the distance of the...
Curated OER
Reading Graphs
Working independently or in teams, your class practices connecting graphs, formulas and words. This lesson includes a guided discussion about distance vs. time graphs and looking at how velocity changes over time.
Curated OER
What's Your Shoe Size? Linear Regression with MS Excel
Learners collect and analyze data. For this statistics lesson, pupils create a liner model of their data and analyze it using central tendencies. They find the linear regression using a spreadsheet.
Curated OER
Is there Treasure in Trash?
More people, more garbage! Young environmentalists graph population growth against the amount of garbage generated per year and find a linear model that best fits the data. This is an older resource that could benefit from more recent...
TeachEngineering
Teach Engineering: Walk the Line: A Module on Linear Functions
This module leads students through the process of graphing data and finding a line of best fit while exploring the characteristics of linear equations in algebraic and graphic formats. Then, these topics are connected to real-world...
Texas Instruments
Texas Instruments: Math Today Wildfire Deaths
In this activity, students will be asked to use the "Wildfire deaths" data to determine a linear model. They will examine the affect an outlier has on the model and compare methods to determine the best model.
Texas Instruments
Texas Instruments: Math Today Population on the Move
In this activity students will determine the rate of change (slope) & build a linear model (y = mx + b) from this data. The model will be used to make a prediction about the future growth of the population of the U.S. if the current...
Texas Instruments
Texas Instruments: Math Today for Ti Navigator System More of u.s.
Using the USA TODAY Snapshot, "More of U.S.," students will learn how to interpret data presented in a graphical form. Students will determine the rate of change (slope) and build a linear model (y = mx + b) from this data. The model...
Texas Instruments
Texas Instruments: Math Today for Ti Navigator System Cropland Value Grows
Students will create a scatter plot for the data in the USA TODAY Snapshot, "Cropland value grows," and identify the independent and dependent variables for the data. The students will find the rate of change for the data and label this...
Texas Instruments
Texas Instruments: Science Today More of u.s.
Students examine the USA TODAY Snapshot "More of U.S.", construct a graph from the data, produce a mathematical model (linear) for the data, determine the rate of change for the data, and make predictions about future population levels.
Texas Instruments
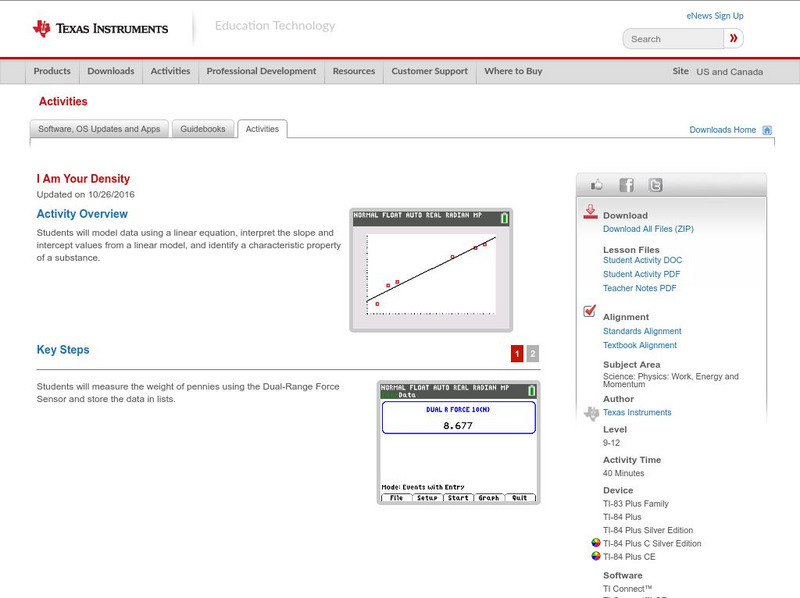
Texas Instruments: I Am Your Density
In this activity you will: Model data using a linear equation; interpret the slope and intercept values from a linear model; identify a characteristic property of a substance; and examine the relationship between mass, volume, and density.
Texas Instruments
Texas Instruments: It's a Small World
In this activity, students collect population data for the world on 10 different days and then find a model for the data set assuming that over a short period of time the data can be considered linear. Finally, they evaluate the model...
Texas Instruments
Texas Instruments: Finding Linear Models
Students graph a scatter plot, find average rate of change, develop a linear model, find a linear regression and a median/median line for a set of data graphed in a scatter plot and predict profit.
Stefan Warner and Steven R. Costenoble
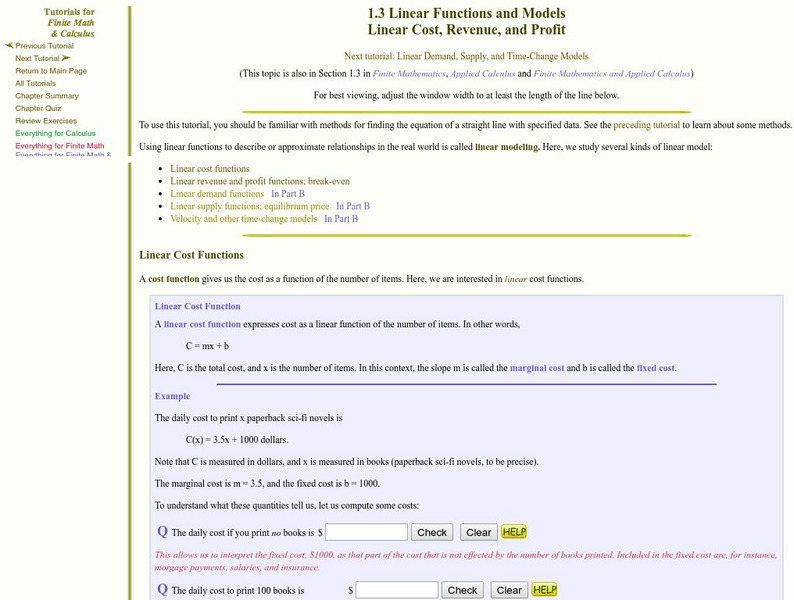
Finite Mathematics & Applied Calculus: Linear Cost, Revenue, and Profit
The tutorial explores linear models. Students learn about the concepts through class notes, examples, and practice problems. Topics include linear cost, revenue, and profit. Review exercises and a chapter quiz are included.
Illustrative Mathematics
Illustrative Mathematics: S Id.7 Used Subaru Foresters
Jane wants to sell her Subaru Forester and does research online to find other cars for sale in her area. She examines the scatterplot of price versus age and determines that a linear model is appropriate. Answer a variety of questions...
Illustrative Mathematics
Illustrative Mathematics: S Id.6a,7 Olympic Men's 100 Meter Dash
This task asks learners to identify when two quantitative variables show evidence of a linear association and to describe the strength and direction of that association. Students will use a scatterplot showing the finishing times for the...
CK-12 Foundation
Ck 12: Algebra: Determining the Equation of a Line
This comprehensive study guide highlights the main terms and formulas needed to determine the equation of a line. Examples are included.
Thinkport Education
Thinkport: Algebra Ii: Linear, Quadratic and Exponential Regression
Review linear regression and analyze how well this model fits the data. You will also be introduced to residuals and the correlation coefficient, and use these tools to determine whether or not a linear model is the best fit for a set of...
ClassFlow
Class Flow: Linear Models
[Free Registration/Login Required] Students will learn the different forms of an equation of a line and will find the equations of a line in all three forms- point-slope form, slope-intercept form, and the general form (Ax+By=C).
BBC
Bbc: Statistical Skills: Comparing Data Sets Using Statistics
This site is a demonstration of Comparing data sets using statistics and forming a linear model from a given set of data. Examples and a practice test are included.


