Illustrative Mathematics
Illustrative Mathematics: 8.sp.1 Hand Span and Height
This task looks at a possible relationship between height and hand size. Students collect data from classmates, make a scatter plot, and explain the relationship as linear or nonlinear. Aligns with 8.SP.A.1.
Illustrative Mathematics
Illustrative Mathematics: 8.f Chicken and Steak, Variation 2
This task has students write an equation to calculate the amount of chicken and steak that can be purchased while staying within a given budget. Students then graph the function and analyze it, discussing the dependent relationship...
Illustrative Mathematics
Illustrative Mathematics: 8.f Baseball Cards
This task has the context of a baseball card collection. Students are shown four equations that might represent the number of cards in the collection where the total is a function of time. They are asked to explain what we can learn...
Illustrative Mathematics
Illustrative Mathematics: 8.f Chicken and Steak, Variation 1
This task has students find a linear function that will calculate the amount of chicken and steak to purchase in order to stay within a given budget. Students then graph the function and interpret it. Aligns with 8.F.B.4.
Khan Academy
Khan Academy: Intercepts From an Equation
Solve linear equations for the x-intercept and y-intercept. Students receive immediate feedback and have the opportunity to try questions repeatedly, watch a video or receive hints.
Khan Academy
Khan Academy: Intercepts From a Table
Find the intercepts of a line given a table of values. Students receive immediate feedback and have the opportunity to try questions repeatedly, watch a video, or receive hints.
Khan Academy
Khan Academy: Linear Equations in Any Form
You've had practice with a few different forms of linear equations. In this exercise, you must study the line graph and write the equation for it in whichever format you choose. Students receive immediate feedback and have the...
CK-12 Foundation
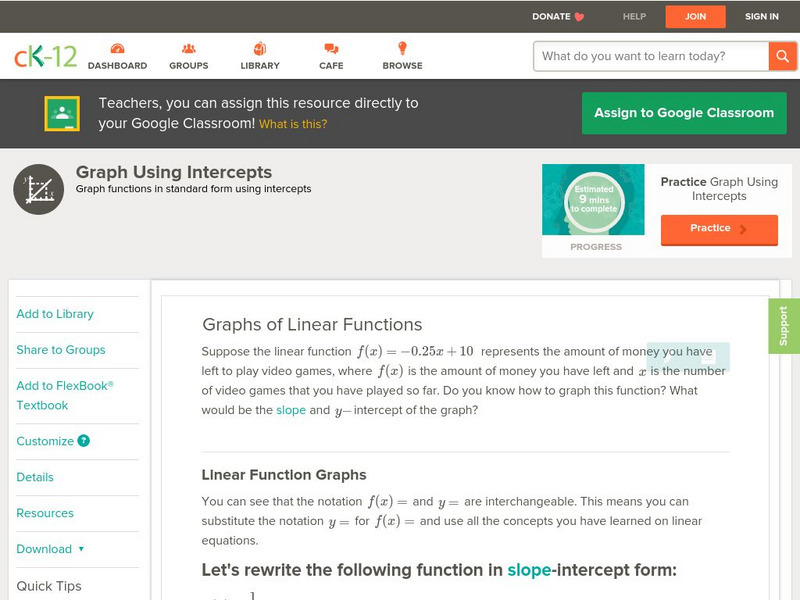
Ck 12: Algebra: Graph Using Intercepts: Graphs of Linear Functions
[Free Registration/Login may be required to access all resource tools.] In this tutorial, students learn how to make and analyze graphs of linear functions. They examine guided notes, review guided practice, watch instructional videos,...
PBS
Pbs: Modeling the Linear Relationship Between Fahrenheit and Celsius
Explore the relationship between degrees Fahrenheit and degrees Celsius. This video focuses on developing an expression to model the relationship between the temperature scales using a line graph to calculate slope and the y intercept.
PBS
Pbs: Bivariate Data and Analysis: Anthropological Studies
Investigate how skeletal populations can help determine the impact of slavery on the height and health of African American males. This video focuses on the measurements and equations Mark Mack is using to explore relationships between...
Sophia Learning
Sophia: Finding Rates of Change in Linear Relationships: Lesson 3
This lesson demonstrates how to find the rate of change in functions with linear relationships. It is 3 of 5 in the series titled "Finding Rates of Change in Linear Relationships."


