Curated OER
Drive the Data Derby
Three days of race car design and driving through the classroom while guessing probability could be a third graders dream. Learn to record car speed, distances traveled, and statistics by using calculation ranges using the mean, median,...
Discovery Education
Fuss About Dust
Dust is everywhere around us; it's unavoidable. But what exactly is dust and are certain locations dustier than others? These are the questions students try to answer in an interesting scientific investigation. Working independently or...
Illustrative Mathematics
Weather Graph Data
Teaching young mathematicians about collecting and analyzing data allows for a variety of fun and engaging activities. Here, children observe the weather every day for a month, recording their observations in the form of a bar graph....
Curated OER
Histograms
Young statisticians explore the concept of histograms. They construct histograms of various data such as change in a student's pocket, and guessing on a test. hHey analyze data represented as a histogram and a box plot and compare...
Curated OER
Many Ways to Represent Our Data
Demonstrate several ways to represent data with your class. They will use surveys to gather data and display the data using tally charts and graphs. Then answer questions according to the data.
Alabama Learning Exchange
Ice Cream Sundae Survey
Young scholars analyze data through graphs. They will complete a class survey on ice cream sundaes and tally and graph the responses. They then analyze the information from the class graph.
Curated OER
Representing Data
Second and third graders answer questions based on data presented to them in graphs. They see how to interpret data from a bar graph, line graph, and a chart.
Curated OER
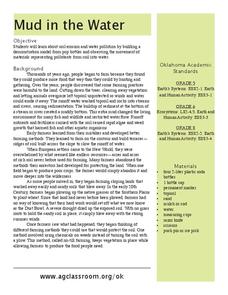
Mud in the Water
Sixth graders investigate erosion. In this erosion instructional activity, 6th graders explore how farming changes the environment. Students construct an erosion model and research ways to protect the soil from excess mud generated by...
Curated OER
Descriptive Statistics
Students demonstrate how to use frequency and scatter diagrams. In this statistics lesson, students are introduced to different techniques of representing data. Students sort and graph data on a worksheet and use a frequency diagram to...
American Association for the Advancement of Science
Aaas: Project 2061: Topic: Models
[Free Registration/Login Required] Create a science test that checks for student understanding in science, for common misconceptions, as well as for correct ideas. This is a list of key ideas related to Models. For each key idea, you...
University of California
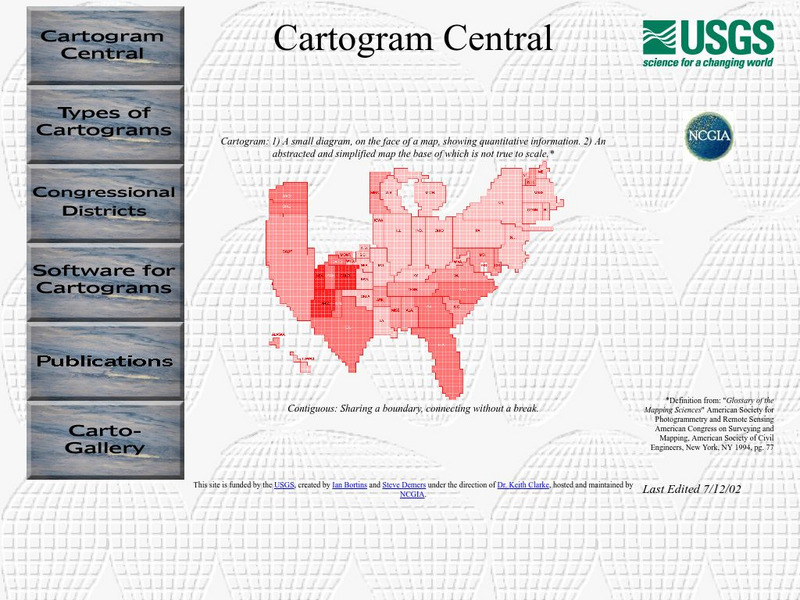
Us Geological Survey: Cartogram Central
The USGS offers detailed information on Types of Cartograms, Congressional Districts, Software for Cartograms, Publications, and a Carto-Gallery.
Oswego City School District
Regents Exam Prep Center: Scatter Plots and Line of Best Fit
Use this lesson, practice exercise, and teacher resource in planning instruction on scatter plots and line of best fit. In the lessons, you'll find definitions and examples of ways to make a scatter plot, determine correlations, and find...
Government of Alberta
Learn Alberta: Math Interactives: Exploring Data Display and Graphs
This multimedia Learn Alberta math resource focuses on graphing data. In the video portion, students will see how math is involved in the display of merchandise in stores. The accompanying interactive component provides an exploration...
Education.com
Education.com: 1.md.c.4 Worksheets
[Free Registration/Login Required] These worksheets can help students practice organizing, representing, and interpreting data with up to three categories. Choose from among 25 worksheets based on your student's needs.
PBS
Pbs Kids Afterschool Adventure!: Operation: Data Saves the Day Activity Plan
Data comes to the rescue! Children will collect, analyze, and represent data as they try to dodge a series of catastrophes faced by characters from their favorite PBS Kids shows.
PBS
Pbs Kids Afterschool Adventure!: Operation: Martha's Stem Stories Activity Plan
Welcome to Martha's STEM Stories! STEM stands for science, technology, engineering, and mathematics. You may already know that doing STEM means testing ideas, collecting data, making calculations, and drawing graphs and charts-but you...
PBS
Pbs Kids Afterschool Adventure!: Operation: All About Us Activity Plan
It's time to stand in the spotlight! During this Afterschool Adventure, children will learn about and practice a variety of math skills as they gather information about their favorite subject-themselves! Children will start out by...
University of Illinois
University of Illinois: Line Graphs
Line graphs are shown and explained here. You can learn what kind of data is best represented using a line graph. There are also line graphs with questions and answers available to help you learn how to read them.
US Department of Education
Nces Kids: Creating an Area Graph
This is where you will find step by step directions explaining how to create an area graph. Complete each step and click on the next tab. Directions are simple and clear.
Texas Instruments
Texas Instruments: Math Today Challenge New Color of Money
In this activity, students will read about the changes in the "new money" and then create a graph to represent various combinations of currency produced. This activity provides an excellent example of discrete, real-world data.
Texas Instruments
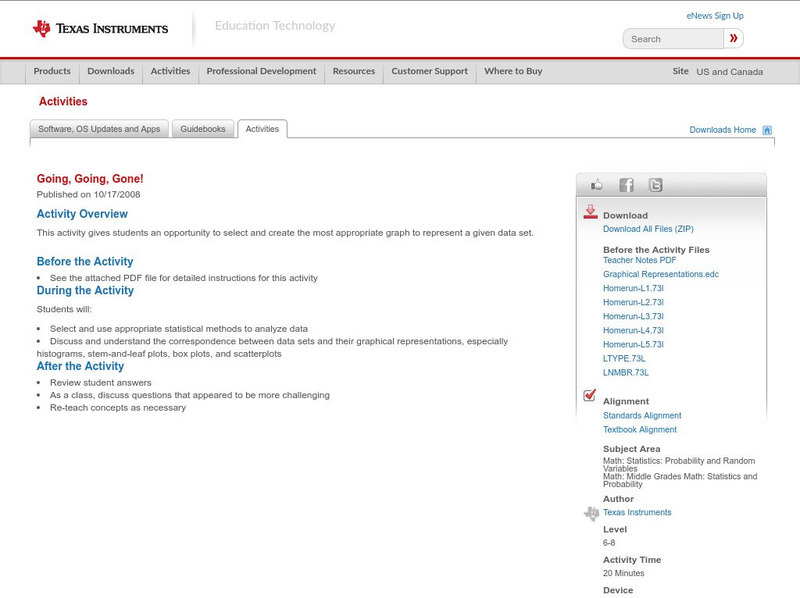
Texas Instruments: Going, Going, Gone!
This activity gives students an opportunity to select and create the most appropriate graph to represent a given data set.
Texas Instruments
Texas Instruments: Do You Have a Temperature?
In this activity, students represent and analyze climate data. They use linear regressions to understand the relationship between temperatures measured in the Fahrenheit and Celsius scales and examine conversion factors.
Other
Global Grocery List Project: Homepage
At this site from the Global Grocery List Project, students collect data on the prices of common grocery items and submit their findings. They can then compare the data they collected to data from students around the world. There are...
The Franklin Institute
Frankin Institute Online: Group Graphing
This site from The Franklin Institute explores how to make a simple graph using a spreadsheet to portray survey data. It also gives a set of interesting sports-related web sites so that students can get statistical inforamtion.


