Curated OER
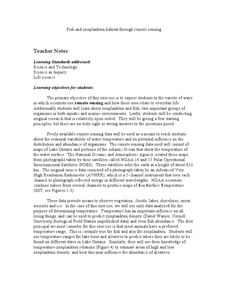
Fish and Zooplankton Through Remote Sensing
Ecology aces examine sea surface temperature maps and relate temperatures to concentration in fish and zooplankton populations. Take your class to a computer lab and provide experience with actual remote sensing data. Some of the links...
Curated OER
El Nino Lesson
Students compare graphs of weather occurrences. In this environmental lesson plan, students will being using the website to gather weather related information for a certain time period. The students will then graph the data that will be...
Curated OER
Fostering Geospatial Thinking: Space to Earth: Earth to Space (SEES)
Students locate and access data to help them with their science inquiry. In this geographical positioning lesson students evaluate and compare data sets.
Curated OER
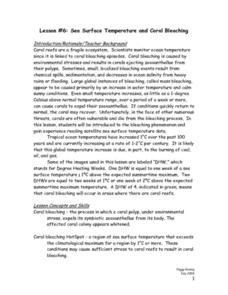
Lesson #6: Sea Surface Temperature and Coral Bleaching
Fifth graders examine the concept of coral bleaching and sea surface temperature. They view a teacher demonstration, interpret sea surface temperature data, explore a website, and complete worksheets.
Curated OER
Sea Surface Temperature Trends of the Gulf Stream
Pupils use authentic satellite data to produce plots and graphs of sea surface temperature as they explore the seasonal changes of the Gulf Stream.
Curated OER
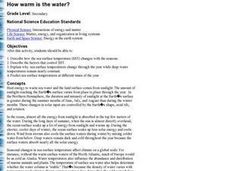
How Warm is the Water?
Students research how surface sea temperature changes throughout the year. They draw a time series of sea surface temperatures for each month of the year and a depth profile for a summer and winter month using an OceanExplorer Profiler...
NASA
Jet Propulsion Laboratory: Global Climate Change: Sea Level Viewer
This viewer allows you to see ocean heat storage from space. These images indicate sea surface heights. Learn more about El Nino and La Nina and how they have profound effects on world climate.
NASA
Nasa Earth Observatory: Global Maps: Sea Surface Temperature
This global map from NASA's Earth Observatory shows the sea surface temperature from July 2002 to October 2008. Learn the influences that sea surface temperature has on climate and weather.
Science Education Resource Center at Carleton College
Serc: Whither Arctic Sea Ice?
For this lesson students will access and analyze sea ice data. By the end of the lesson students should be able to measure the seasonal variations in sea ice extent, discover long-term changes occurring in sea ice extent, visualize the...
Climate Literacy
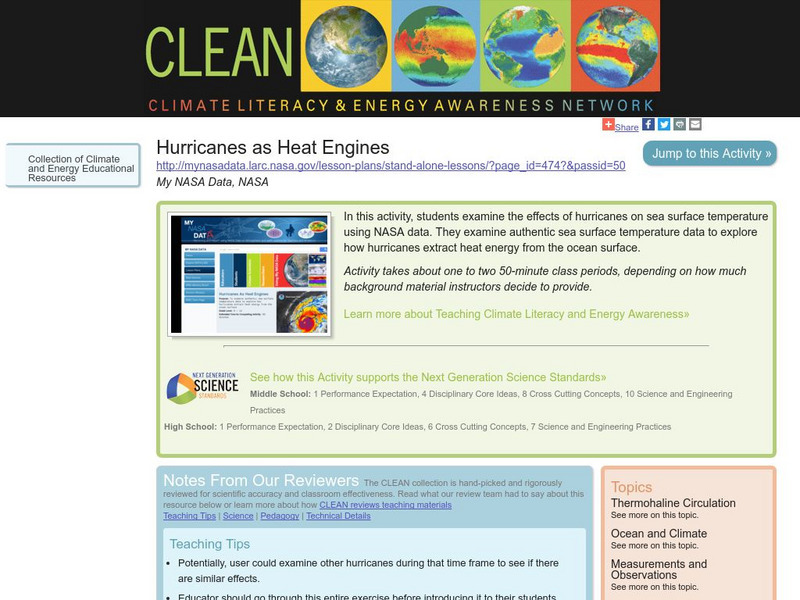
Clean: Hurricanes as Heat Engines
In this activity, young scholars examine the effects of hurricanes on sea surface temperature using NASA data. They examine authentic sea surface temperature data to explore how hurricanes extract heat energy from the ocean surface.
Exploratorium
Exploratorium: Global Climate Change: Hydrosphere
Use this site to explore real scientific data relating to the hydrosphere. With this information you can gather evidence, test theories, and come to conclusions. Click on the data examples to view a full scale version.


