Curated OER
Graphing the Forecast-Line Graph or Bar Graph?
Learners explore bar and line graphs. In this data collection, graphing, and weather lesson, students compare bar and line graphs and discuss which type of graph would be most appropriate for displaying a ten day weather forecast....
Curated OER
Exponents
Sixth graders explore mathematics by participating in a SMART Board activity. In this exponents lesson plan, 6th graders identify the different exponential powers of a number and discuss how the power of the number accumulates. Students...
Curated OER
Ancient Greece Predicting Outcomes
Sixth graders explore world history by utilizing a SMART board. In this Greek history lesson, 6th graders read different Ancient Greece scenarios and match them with a selection from a list of probable outcomes. Students identify Mt....
Curated OER
Classification of Animals
Students explore animal characteristics by participating in a SMART board activity. In this animal classification lesson, students utilize a sorting chart to divide different animal names by their observable characteristics. Students...
Curated OER
Smart Jeopardy Review
Students review information from their class by participating in a mock Jeopardy game. In this study habits lesson, students view Jeopardy style questions from a PowerPoint presentation and answer them via a Smart Board. Students are...
Curated OER
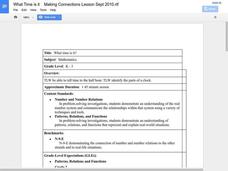
What Time is It?
Students explore time by completing worksheets. In this time-telling lesson plan, students utilize images of clocks and determine what time they read. Students answer more clock questions with a Smart Board and complete a clock worksheet...
Curated OER
Mitchell Road Investigation
Seventh graders discover the impact of man on the environment by analyzing plant and animal data. In this ecology lesson, 7th graders investigate a nearby road which many cars pass on and examine the impact of the road on the remaining...


