Curated OER
Times Tables - Multiplication
Introduce students to multiplication through this fantastic math worksheet. Provides beginners with an explanation of multiplication as repeated addition using pictures to help students visualize the meaning and process of multiplying....
Illustrative Mathematics
Walk-a-thon 2
During a walk-a-thon your learners must determine the walking rate of Julianna's progress. Using tables, graphs, and an equation, they must be able to calculate the time it took her to walk one mile and predict her distance based on the...
Illustrative Mathematics
Two-School Dance
Who's ready for the dance? When two middle schools combine for a dance, your learners' job is to calculate the ratio of girls attending. Provided with three different solutions, you can choose from setting up a ratio, linear equation, or...
Illustrative Mathematics
Walk-a-thon 1
Your mathematician's job is to explore the relationship between hours and miles walked during a walk-a-thon. The activity compels your learners to experiment with different means in finding out this proportional relationship. The answer...
Curated OER
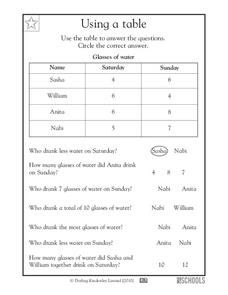
Using a Table
Tables are no help if your scholars can't read them; provide some excellent beginner-practice using this table example and accompanying comprehension questions. Learners examine the data first, which charts the number of glasses of water...
Curated OER
Tables
Can you read this table? Learners begin to comprehend data analysis through examining two simple tables and answering comprehension questions. The first gives characteristics about three animals in yes-or-no format (i.e. "eats insects,"...
Curated OER
Reading Tables
Who is two years younger than Meg? Who is older than Paul, but not Kinta? Scholars practice reading tables as they answer comprehension questions based on three sets of data. First, they examine a table depicting ages, then favorite...
Curated OER
Tables and Graphs
Help pupils read graphs and tables with these examples and data comprehension questions. First they examine a bar graph to answer five analysis prompts. Note this graph doesn't have a label along the y-axis, so you may want to do this...
Curated OER
Mathematics: A Picture's Worth a Thousand Words
Students examine school yearbooks from 1950 to the present. They count the number of male and female teachers and administrators. They compile date and extrapolate changes in job trends.
Primary Resources
Ratio and Proportion
A great way to practice ratio and proportion problems. There are three word problems that set the stage, images and table help learners see how each problem is solved. A very useful tool when introducing or reviewing proportions and ratios.
Curated OER
Data Displays with Excel
Students collect and analyze data. In this statistics lesson, students display their data using excel. They plot the data on a coordinate plane and draw conclusion from their data.
Curated OER
Problem Solving: Make a Table
In this problem solving worksheet, 2nd graders solve and complete 4 different problems that include counting different amounts of coins. First, they determine the number of nickels and dimes in each. Then, students determine the total...
Curated OER
Bicycles & Tricycles
In this bicycles and tricycles worksheet, learners solve and complete 8 different problems that include counting the number of bicycles and tricycles in each store. First, they complete the table for the number of wheels on the bikes in...
Curated OER
Nutritional Relationships Chart
Producers, Herbivores, Carnivores, Decomposers, oh my! Help organize the intricacies between these four types of eaters with this biology activity. Scientists display nutritional relationships in a graphic organizer. They place 15 terms...
Curated OER
Lesson 6-7: Scatter Plots and Equations of Lines
For this scatter plot worksheet, students examine tables and write a linear equation that matches the table. Students graph linear equations. They read scatter plots, determine the trend line, and write a linear equation to match...
Curated OER
Linear Relations
In this linear relations worksheet, students complete a table for given functions. They classify graphs as linear or non-linear. Students graph given equations. They compare and contrast graphs. This nine page worksheet contains five...
Curated OER
Use or Make a Table
In this use or make a table worksheet, students examine data given in a story problem. They use logic to determine the best way to begin organizing the data and creating a table. This one-page worksheet contains three problems. ...
Curated OER
Tables and Graphs Practice
For this table and graph worksheet, students are given three scenarios with data. They construct a table and a graph for each scenario.
Curated OER
Graphing Applications
In this graphing applications activity, students derive equations for 4 word problems. Students then define variables, find intercepts, graph the equations, and interpret the slopes.
Curated OER
Cricket Weather
In this collecting data worksheet, 4th graders use the data collected on crickets chirps and the temperature to make a line graph by following 4 directives.
Curated OER
Mean, Median, Mode, and Range
In this mean, median, mode, and range worksheet, students define and solve 5 detailed questions that include finding the mean, median, mode, and range of numbers. First, they calculate the mean, median, mode, and range for each set of...
Curated OER
Modeling in Algebra
In this modeling in algebra worksheet, 8th graders solve ten different types of algebra problems, including 5 word problems. They first complete each table, describe the pattern used, and determine the 20th and nth term for each....
Curated OER
Comparing Costs
Students compare the costs of two cellular phone plans and determine the best rate. They use a table and a graph of points plotted on a Cartesian plane to display their findings. Students write an equation containing variables that could...
Curated OER
Let's Get Organized
Sixth graders identify table and each of its parts, including cell, column, row, header, and formula bar. Students then explain how tables are used to store and organize information in database, organize and categorize information...


