Curated OER
Linear Regression and Correlation
Learners explore scatter plots. In this linear regression activity, groups of pupils graph scatter plots and then find the line of best fit. They identify outliers and explain the correlation. Each group summarizes and shares their...
Curated OER
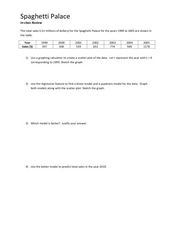
Spaghetti Palace
For this spaghetti palace worksheet sheet, students examine data and create a scatter plot. They use their graphing calculator to find a linear model and a quadratic model for given information. Students predict total...
Curated OER
Baseball Relationships - Using Scatter Plots
Students use graphing calculators to create scatter plots of given baseball data. They also determine percentages and ratios, slope, y-intercepts, etc. all using baseball data and statistics.
Curated OER
Business & Statistics: Final Exam
In this business and statistics worksheet, learners read real-life business problems, arrange data, and identify the probability method best used to determine the answer. They identify the type of random sample, draw stem-and-leaf plots,...
Curated OER
Linear Systems: Least Square Regression
In this least square regression worksheet, students find solutions to given linear systems. They draw pictures, draw a vector and prove the solution. This two-page worksheet contains eleven problems, with some examples and explanations.
Duke University
Duke University: Web Feats Ii: Lessons on Regression at Hessian
This site has several lessons on regression, "Designed to help students visualize topics associated with lines of regression, given a set of data points." Go to the teacher notes to find the objectives and standards which apply.
York University
Classics in the History of Psychology: Cognitive Maps in Rats and Men
A Classic Psychological work by Edward Tolman from 1948. His experiments with rats led to discussion of cognitive maps in man.
Vassar College
Vassar College: Multiple Regression
This is an interactive site allowing the student to input data (one dependent and three independent variables) and then letting the computer calculate the regression between these multiple forces.
Other
Stat Soft: Multiple Regression
This resource has a lot of information on multiple regression. It also contains information on the regression line.
Missouri State University
Missouri State University: Introductory Statistics: Linear Regression Models
Four examples which use the linear regression model in real-world applications. The site continues with discussion on how to correctly construct the regression model, how its results can be analyzed, and what can come from it.
Texas Education Agency
Texas Gateway: Modeling Data With Linear Functions
Given a scatterplot where a linear function is the best fit, the student will interpret the slope and intercepts, determine an equation using two data points, identify the conditions under which the function is valid, and use the linear...
CK-12 Foundation
Ck 12: Applications of Function Models
[Free Registration/Login may be required to access all resource tools.] A collection of resources for exploring word problems using function models.
Science Education Resource Center at Carleton College
Serc: The Sedimentary Processes of Transgression and Regression
This article gives a detailed explanation of how transgression and regression of sea levels work to create deposits of sedimentary rocks. Illustrations show the layering that takes place over time. The article discusses how geologists...
Wolfram Research
Wolfram Math World: Probability and Statistics
This is a resource for many topics in probability and statistics. Click on the topic of your choice for an explanation. The sites you will be linked to are quite extensive. A degree of higher-level math is necessary for understanding...
Texas Instruments
Texas Instruments: Using Cbr and Ti Navigator to Create a Regression Equation
In this activity, students generate data points using the CBR and store them as lists. Then, transfer the lists to the Activity Center to be graphed. The students will attempt to come up with a suitable regression equation.
Texas Instruments
Texas Instruments: Canadian Life Expectancy
In this activity, students analyze statistical data Using the calculator and the TI-InterActive! software. They perform regression on the data to find the life expectancy of people in Canada.
Texas Instruments
Texas Instruments: Work vs. Leisure
Students can use lists of data and the correlation factor of various regressions to determine the best regression line.
Texas Instruments
Texas Instruments: Bacterial Growth and Regression
This activity gives students a set of data to perform a regression analysis. Students need to be able to read the data, perform a regression, and interpolate and extrapolate information.
Texas Instruments
Texas Instruments: Forecasting
Students use regression to forecast values from a data. They study exponential smoothing. They also use the program FORECAST to automate a multiplicative model.
Texas Instruments
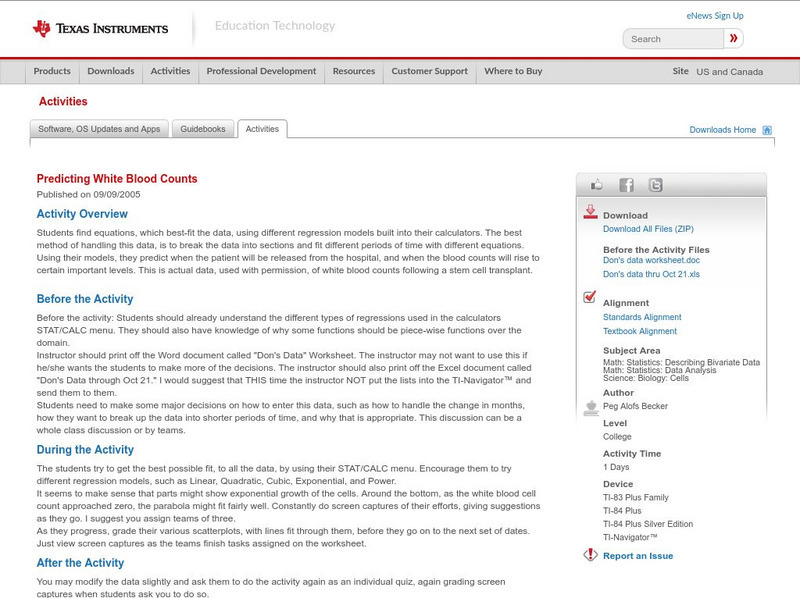
Texas Instruments: Predicting White Blood Counts
Students find equations, which best-fit the data, using different regression models built into their calculators. The best method of handling this data, is to break the data into sections and fit different periods of time with different...
Texas Instruments
Texas Instruments: Bungee Jumper
Teacher will simulate a Bungee Jumper and have students predict when a Jumper would hit the ground.
Science Education Resource Center at Carleton College
Serc: Investigating Rock Layers and Fossils to Infer Past
This activity is an inquiry-based field investigation of the sedimentary geology of Lilydale Regional Park's brickyards area, a bluff and slope location near St. Paul Minnesota's Harriet Island and Cherokee Heights Park. Students...
Ministry of Education and Universities of the Region of Murcia (Spain)
Ministerio De Educacion Y Ciencia: Variable Estadisticas Bidimensionales
In Spanish. This interactive unit shows you the statistical relationship between two variables.
Other
Stat Soft: Statistics Glossary
Dozens of statistical terms are defined and illustrated in this glossary.


