Curated OER
Developing the Concept: Rates
Learners discover how to use the knowledge of unit rates to understand equivalent ratios and solve real-world problems. They are given word problems to solve using equivalent ratios. Tables are also covered in this resource.
Curated OER
Hopes and Dreams: A Spreadsheet Lesson Using Excel
Fourth graders read "The Far Away Drawer" by Harriet Diller and discuss the story as a class. After discussion, 4th graders create a t-shirt GLYPH about their hopes and dreams,share their information with the class and create spreadsheets.
Curated OER
Data and Tables
In this data and tables worksheet, students use a given data table to answer a set of 8 questions. A website reference is given for additional resources.
Curated OER
Tables & Data
For this tables and data worksheet, 4th graders complete word problems based on a table of leaves collected. Students complete 8 problems.
Curated OER
Tables and Data
In this tables and data worksheet, 4th graders complete word problems based on the tables and data of students recycling cans. Students complete 8 problems total.
Curated OER
Tables and Data
In this tables and data worksheet, students use a given data table to answer a set of 8 questions. A website reference for additional activities is given.
Curated OER
Word Problems
Students solve word problems using mathematical symbols. In this algebra lesson plan, students collect data and analyze it. They analyze the data using a table or graph after plotting the data.
Curated OER
Graphing Fun In Third Grade
Third graders display information in a graph, table, and chart. In this data lesson plan, 3rd graders look at graphs, tables, and charts, discuss their importance, and make their own.
Curated OER
Proportionality in Tables, Graphs, and Equations
Students create different methods to analyze their data. In this algebra lesson, students differentiate between proportion and non-proportional graph. They use the TI-Navigator to create the graphs and move them around to make their...
Curated OER
Seven Rates and Ratio Problems Using Tables
For this rates and ratios worksheet, students complete tables given rates. This worksheet contains seven multi-part problems where students discover the steps to ratio problems.
Curated OER
Skittles, Taste the Rainbow
Fifth graders learn and then demonstrate their knowledge of a bar and a circle graph using the classroom data. Students are given a pack of skittles candy. Students create a bar and circle graph indicating the results of the contents of...
Curated OER
Challenge: Logical Reasoning-Working With Tables
In this logical reasoning worksheet, students write yes or no about the number of teeth various animals have, completing a table to solve 5 questions, then read a set of clues and draw a table to solve 6 questions.
Curated OER
Savings Planning Using Tables, Line Graphs and Early Proportionality
Students use proportional reasoning to make a chart of daily savings transactions and balances. In this accounting lesson, students read word problems and complete three handouts about a bidding and accounting problem. Students finish...
Curated OER
Algebra- Cell Phone Plans
High schoolers analyze graphs to compare cell phone plans. In this algebra lesson, students work together to analyze phone plans and report the best phone plan. High schoolers develop tables and graphs.
Curated OER
Pounds of Paper
For this collecting of data worksheet, 2nd graders study and analyze a pounds of paper table in order to solve and answer 6 mathematical questions.
Curated OER
Tables Grids
In this multiplication worksheet, students learn how to fill out a multiplication table or grid. They then fill one out on their own with 36 blank spaces. The answers are on the last page.
Curated OER
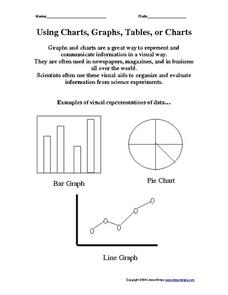
Using Charts, Graphs, Tables, or Charts
In this charts, graphs and tables activity, students view 3 different types of visual representations of data, make a list of 20 items and decide how the items can best be put together in groups to make a graph, chart or table. Students...
Curated OER
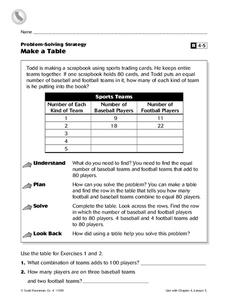
Make a Table
In this charting activity, 4th graders complete a table. Using the information provided, students fill in the missing data and complete 2 short answer questions.
Curated OER
Charting and Graphing Sales
Students analyze and represent weekly sales figures using tables, bar graphs, and pie charts. They draw conclusions using bar graphs and pie charts. Students are told that each day at school they have the option of buying or bringing a...
Curated OER
Spaghetti and Meatballs for All
Fourth graders are read the story "Spaghetti and Meatballs for All". Individually, they are given a set of tiles and cubes to determine how 32 people can sit around tables. While being read the story again, they develop different...
Curated OER
Information at a Glance - Using Tables in Mathematics
Students create table to display GED Testing data located in paragraph provided by teacher, use information in table to create appropriate graph, and determine percentage difference between passing scores and failing scores.
Curated OER
The Why and How of General Terms
Sixth graders find the recurrence relation for simple sequences
construct tables of values for a pattern. They find the value of the general term of a sequence algebraically.
Curated OER
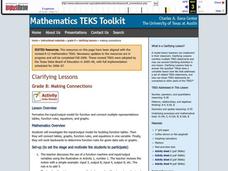
Making Connections
Eighth graders investigate the input/output model for building function tables. From the data, 8th graders connect tables, graphs, function rules, and equations in one variable. They work backwards to determine function rules for given...
Curated OER
A Data Processing Lesson for Statistics -- Reading a Table or Chart
Students identify the structure and key parts of tables and charts. They determine which data is meanjngful and make comparisons with the data. They describe the scope of the AIDS plague throughout the world.


