California Academy of Science
California's Climate
The United States is a large country with many different climates. Graph and analyze temperature and rainfall data for Sacramento and Washington DC as you teach your class about the characteristics of Mediterranean climates. Discuss the...
Curated OER
Interpreting Position vs. Time Graphs (Still Pretty Basic Stuff)
This is an interactive physics slide show that quizzes viewers about position versus time. It is set up as a series of 10 questions to answer: a graph with a questions slide followed by an answer slide. This is terrific practice in graph...
Curated OER
Energy Worksheet #1
A graph of Earth's average monthly temperatures from 1990 to 1994 is posted across the top of the page for meteorology masters to analyze. Five multiple choice questions are asked regarding temperature variation. This does not have to be...
Curated OER
The Numbers Tell the Story
Students demonstrate how to gather and interpret statistical data. In this data analysis instructional activity, students search for statistics on the health effects of smoking and place the information into charts. Students create these...
Curated OER
Introduction to Graphs: Bar Graphs, Line Graphs, Circle Graphs
In this graphing data worksheet, students answer 5 short answer questions about graphs. Students determine which type of graph best represents various data sets.
Curated OER
Continuity
Students examine graphs to determine if they are continuous at a given point. In this examining graphs to determine if they are continuous at a given point lesson, students examine various graphs. Students determine points on...
Texas Education Agency
Texas Gateway: Interpreting Graphs
Given a graph, the student will analyze, interpret, and communicate the mathematical relationship represented and its characteristics.
Texas Education Agency
Texas Gateway: Writing Verbal Descriptions of Functional Relationships
Given a problem situation containing a functional relationship, the student will verbally describe the functional relationship that exists.
Houghton Mifflin Harcourt
Holt, Rinehart and Winston: Homework Help Independent Practice: Misleading Graphs and Statistics
Get independent practice working with misleading graphs and statistics. Each incorrect response gets a text box explanation and another try. Correct responses are confirmed.
Texas Instruments
Texas Instruments: Falling Down Adventure 5
Students use the CBR 2 to study how a change in mass affects the average speed of a falling object. They graph distance as a function of time, and interpret and analyze graphs representing motion.
The Franklin Institute
Frankin Institute Online: Group Graphing
This site from The Franklin Institute explores how to make a simple graph using a spreadsheet to portray survey data. It also gives a set of interesting sports-related web sites so that students can get statistical inforamtion.
Khan Academy
Khan Academy: Domain and Range From Graph
Given the graph of a function, determine its domain or range. Students receive immediate feedback and have the opportunity to try questions repeatedly, watch a video, or receive hints.
Khan Academy
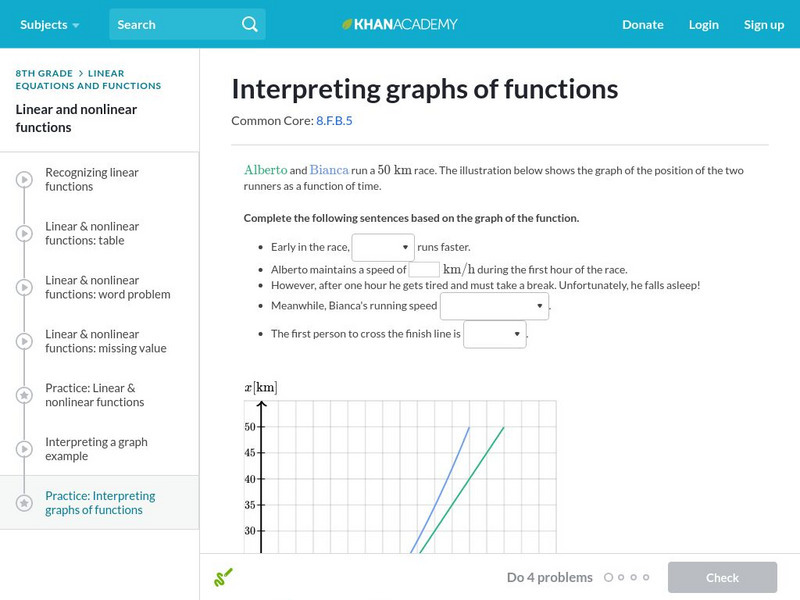
Khan Academy: Interpreting Graphs of Functions
Interpret the graphs of both linear and nonlinear functions. Students receive immediate feedback and have the opportunity to try questions repeatedly, watch a video, or receive hints.
Oswego City School District
Regents Exam Prep Center: Practice With Organizing and Interpreting Data
Several problems are presented to test your skills in creating and interpreting frequency tables, pie charts, box-and-whisker and stem-and-leaf plots.
Illustrative Mathematics
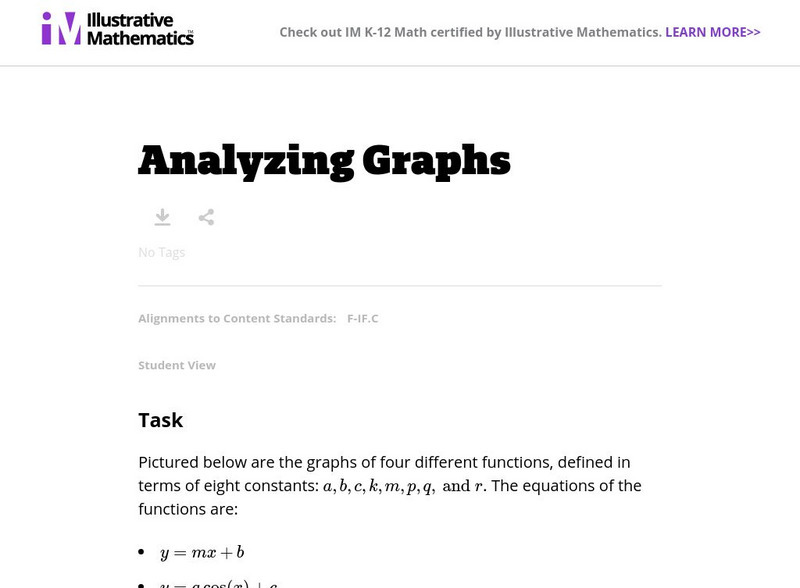
Illustrative Mathematics: F if.c Analyzing Graphs
For this task, students are presented with four different equations and asked to match them with their graphs, then respond to questions about the characteristics of the constants. Aligns with F-IF.C.
CK-12 Foundation
Ck 12: Algebra: Applications of Linear Graphs
[Free Registration/Login may be required to access all resource tools.] In this lesson, students learn how to analyze linear graphs to solve problems. Students watch a video tutorial, explore guided notes and attempt practice problems.
Alabama Learning Exchange
Alex: What's in a Name: Graphing Lesson
A lesson that teaches students how to create and analyze a graph using the letters of their name. The lesson uses the book Chrysanthemum by Kevin Henkes (not included in the lesson plan) to start the discussion.
Houghton Mifflin Harcourt
Holt, Rinehart and Winston: Homework Help Independent Practice: Interpreting Graphs and Tables
Get independent practice interpreting graphs and tables. Each incorrect response gets a text box explanation and another try. Correct responses are confirmed.


