University of South Florida
Fcat: Drops on a Penny: Teacher Notes
Students learn how to create stem-and-leaf diagrams and boxplots by collecting data on the surface tension of water molecules. This hands-on activity using pennies is a great way to learn how to organize data.
Shodor Education Foundation
Shodor Interactivate: Lesson: Algorithm Discovery With Venn Diagrams
The lesson plan, with objectives, lesson outline, and interactive resources, helps students learn about algorithms using box plots and Venn diagrams.
McGraw Hill
Glencoe: Self Check Quizzes 2 Box and Whisker Plots
Use Glencoe's Math Course 2 randomly generated self-checking quiz to test your knowledge of Box-and-Whisker Plots. Each question has a "Hint" link to help. Choose the correct answer for each problem. At the bottom of the page click the...
Annenberg Foundation
Annenberg Learner: Learning Math: Min, Max and the Five Number Summary
Explore how to interpret a large set of data by dividing it up into smaller portions in order to answer statistical questions.
Texas Instruments
Texas Instruments: Get on the Stick
In this activity, students use a CBR 2 to measure the reaction time of catching a stick. They also learn how to interpret a box plot, and make a five number summary of a single variable data set.
Texas Instruments
Texas Instruments: Car Sales
In this activity, students will create a box and whisker plot using a list. The list will be sent using TI-Navigator and contains the number of car sales since 1970. They will determine the values in the box plot and answer some...
Texas Instruments
Texas Instruments: How Tall? Describing Data With Statistical Plots
In this activity, students' will measure their heights using a motion detector and describe the data using the statistical concept called box plot.
Texas Instruments
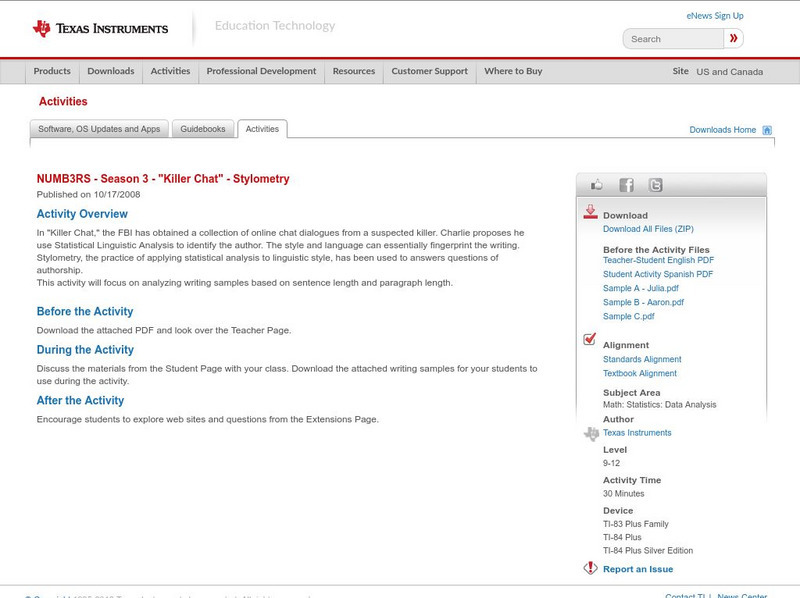
Texas Instruments: Numb3 Rs: Stylometry
Based off of the hit television show NUMB3RS, this lesson has students analyze two samples of writing to determine who is the author of a third piece of writing. While the actual statistics would be overwhelming for students, this lesson...
Texas Instruments
Texas Instruments: Mc Dougal Littell Algebra 1: Box and Whisker Plots
Students will make a box-and-whisker plot and list the first, second, and third quartiles.
Texas Instruments
Texas Instruments: How Many States Have You Visited?
This is a beginner activity for students Using the TI-84. Students will collect data from the class and create a Box & Whisker plot based on how many States students have visited. This is easy for the teacher to learn, and steps are...
CK-12 Foundation
Ck 12: Statistics: Box and Whisker Plots Grade 8
[Free Registration/Login may be required to access all resource tools.] Make Box-and-Whisker Plots to represent data.
CK-12 Foundation
Ck 12: Statistics: Box and Whisker Plots Grades 11 12
[Free Registration/Login may be required to access all resource tools.] This Concept teaches students how to use the five-number summary to make a box-and-whisker plot.
CK-12 Foundation
Ck 12: Statistics: Box and Whisker Plots Grades 8 9
[Free Registration/Login may be required to access all resource tools.] Learn how to use box-and-whisker plots to analyze data.
CK-12 Foundation
Ck 12: Statistics: Box and Whisker Plots Grade 7
[Free Registration/Login may be required to access all resource tools.] Draw and use box-and-whisker plots to display and organize data.
CK-12 Foundation
Ck 12: Statistics: Double Box and Whisker Plots Grades 9 10
[Free Registration/Login may be required to access all resource tools.] Construct and use double box-and-whisker plots.
CK-12 Foundation
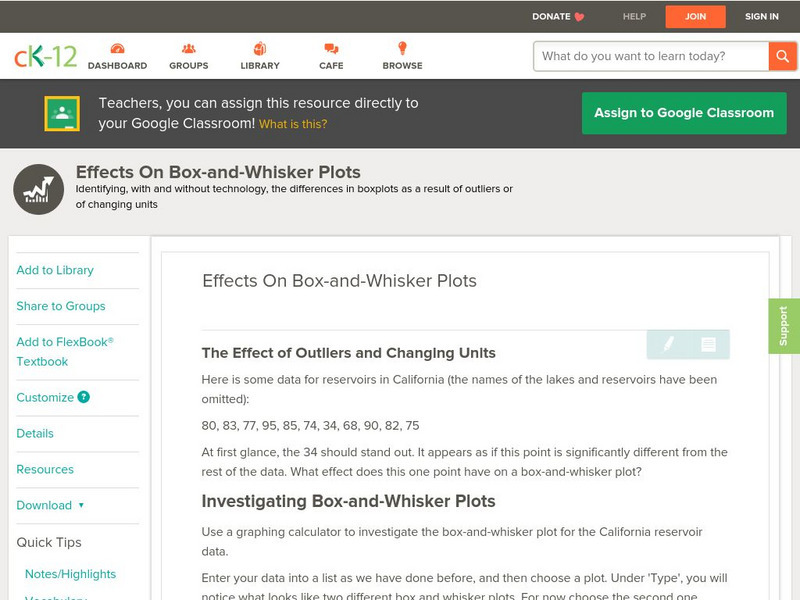
Ck 12: Statistics: Effects on Box and Whisker Plots
[Free Registration/Login may be required to access all resource tools.] This Concept covers the effects of outliers and a change in units on box-and-whisker plots.
CK-12 Foundation
Ck 12: Statistics: Box and Whisker Plots Grades 9 10
[Free Registration/Login may be required to access all resource tools.] Make and interpret a box-and-whisker plot for a set of data.
CK-12 Foundation
Ck 12: Statistics: Quartiles
[Free Registration/Login may be required to access all resource tools.] Order a set of data and understand the measures needed for a box-and-whisker plot.
McGraw Hill
Glencoe Mathematics: Online Study Tools: Box and Whisker Plots
This site gives a short interactive quiz which allows students to self-assess their understanding of the concept of box-and-whisker plots.
Texas Instruments
Texas Instruments: Let's Play Ball With Box and Whisker Plots
This activity is designed to help students make decisions about what and how information could be displayed graphically. The data set deals with salaries of professional baseball players. It is designed for students to determine if the...
CK-12 Foundation
Ck 12: Applications of Box and Whisker Plots Grades 9 10
[Free Registration/Login may be required to access all resource tools.] Use calculators to create box-and-whisker plots.
CK-12 Foundation
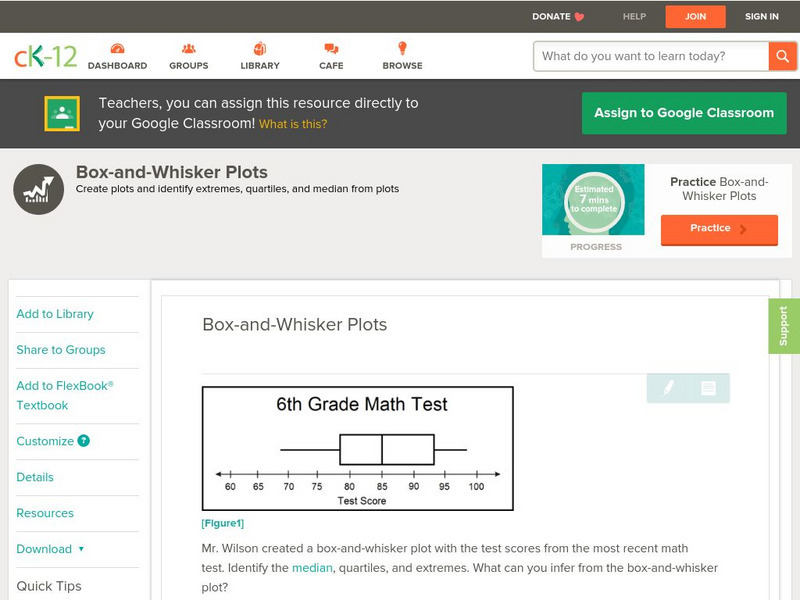
Ck 12: Statistics: Box and Whisker Plots Grade 6
[Free Registration/Login may be required to access all resource tools.] Draw and analyze a box-and-whisker plot.
National Council of Teachers of Mathematics
Nctm: Illuminations: Mean and Median Box and Whisker Plotter
A computer applet that will draw any box and whisker plot with student's data input.
Other
Nmu: Box and Whisker Plot Instructions
Site discusses the use of box-and-whisker plots. An example is presented and completely worked through, so that the user can see the results of the calculations after the steps have been explained.


