Curated OER
Boomerang
Students explore the concept of boomerangs. For this boomerang lesson, students throw homemade boomerangs at different angles to record maximum distance and if it returned or not. Students collect their boomerang data then create a...
Curated OER
Data Displays with Excel
Students collect and analyze data. In this statistics lesson, students display their data using excel. They plot the data on a coordinate plane and draw conclusion from their data.
Curated OER
Graphing Our Marbles
Students collect information pertaining to marble colors found in their bag; then creating a spreadsheet in order to make a chart representing their findings using Microsoft Excel. Students will present their results to small groups.
Curated OER
Statistics of Mars
Students explore the concept of central tendencies. In this central tendencies lesson, students sort M&M's or Skittles based on color. Students graph their results. Students find the mean, median, and mode of their data.
Curated OER
Hit and Run
Pupils explore data collection in this lesson. They investigate distance vs. time and velocity vs. time graphs using information collected with a CBR 2 to simulate the reconstruction of an accident.
Curated OER
Button Bonanza
Collections of data represented in stem and leaf plots are organized by young statisticians as they embark some math engaging activities.
Fort Bend Independent School District
Data Analysis - AP Statistics
What better way to study survey design than to design your own survey! Bring a versatile data analysis project to your AP Statistics class, and encourage them to apply the practices from their instructions to a real-world survey project.
American Statistical Association
Chunk it!
Chunking information helps you remember that information longer. A hands-on activity tests this theory by having learners collect and analyze their own data. Following their conclusions, they conduct randomization simulations to test...
US Department of Agriculture
Sink or Float?
Will it sink or will it float? Learners predict the outcome as they drop random objects into a container of water. Then, they keep track of the results and record the data in a t-chart to draw a final conclusion.
Statistics Education Web
Population Parameter with M-and-M's
Manufacturers' claims may or may not be accurate, so proceed with caution. Here pupils use statistics to investigate the M&M's company's claim about the percentage of each color of candy in their packaging. Through the activity,...
Curated OER
Good Vibrations Remote Sensing data Collection: Thermal Emission Spectrometer
The Mars Global Surveyor spent two years creating a mineral map of the planet Mars using thermal emission spectrometry. To help young astronomers understand this remote sensing instrument, have them simulate how data is collected and...
Curated OER
Box and Whiskers
Middle schoolers discover how to relate collected data with a box and whiskers graph in a number of formats. They collect, organize, create, and interpret a box and whiskers graph. Pupils interpret the difference between sets of data,...
Curated OER
Can You Count on Cans?
How can a canned food drive be connected to math? It's as simple as counting and organizing the cans! Children demonstrate their ability to sort non-perishable foods into categories that include soup cans, vegetable cans, boxed items,...
Curated OER
kind of Bean
Third graders sort different types of beans and collect the data. They create a data table, put the information on the data table and then graph their results. They answer follow-up questions.
Curated OER
The Way to Better Grades!
Pupils collect and analyze data. In this statistics lesson, learners create a scatter plot from their collected data. They use, tables and graphs to analyze the data and mae decisions.
Curated OER
WHAT IS THE POPULAR COLOR?
Fourth graders graph cars according to their colors. They complete the graph including a title, scale, x-axis, and y-axis. Students collect the data and choose the type of graph to be made.
Curated OER
Technology - Data Collection
Young scholars collect and analyze data from the United States Census Bureau. Using spreadsheet technology, students explore their results and make preductions about income groups. Young scholars compute the mean, median and mode. ...
Curated OER
Ice Cream Lab
I scream, you scream, we all scream for ice cream! Even high schoolers enjoy making ice cream. This laboratory exercise has them record the temperature changes throughout the process of liquid becoming solid, graph the results, and...
Curated OER
A Journey with a Scientist
Pupils work in groups as they read chapters of Charles Darwin's, Voyage of the Beagle. They take notes on the chapter and in their group make a timeline of the chapter. They tape the timelines together in order to depict the entire...
Curated OER
Graph Frenzy!!
Young scholars brainstorm for a survey question to ask classmates. They survey their classmates. They enter the results into a spreadsheet and create the best graph for the information. They share their graphs with the class.
Curated OER
What Are Your Favorite Apples?
In this tally instructional activity, students take a survey to determine the favorite apple. They write tally marks beside the apple chosen. For elementary students, this instructional activity may be used for counting purposes and to...
Curated OER
Learning to Read Graphs
What is your favorite pet? This is a great tool for youngsters just learning how to read and interpret graphs. There are four simple questions. Consider extending this activity by creating a class bar graph: how many learners have a dog,...
Curated OER
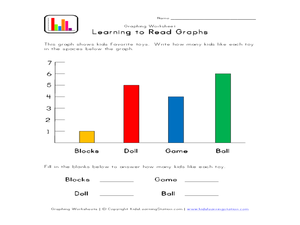
Learning to Read Graphs 2
Do you like playing with blocks, dolls, games, or balls? Use this basic graph to review bar graphs with young learners. After completing the four questions below, consider creating your own class graph: who likes blocks the best? Who...
Curated OER
I Will Meet You In The Middle
Students use the 50 States Quarter Reversal as a context of learning a curriculum concept based from the state of Utah. They research the concepts of cause and effect. Also, they use customary units of measurement to find length and...
Other popular searches
- Collecting and Recording Data
- Data Collection Techniques
- Math Lessons Data Collection
- Data Collection Activity
- Data Collection and Median
- Data Collection and Graphs
- Data Collection Projects
- Data Collection and Analysis
- Accurate Data Collection
- Data Collection Lesson Plans
- Experimental Data Collection
- Collection of Data


