Curated OER
Comparison of Snow Cover on Different Continents
Students use the Live Access Server (LAS) to form maps and a numerical text file of snow cover for each continent on a particular date and analyze the data for each map, corresponding text file to determine an estimate of snow cover for...
National Wildlife Federation
I’ve Got the POWER Wind Energy Potential at Your School
The 20th lesson in a 21-part series connects the wind data and expectations of a turbine to whether such devices should be built in your area. Scholars begin with estimating the wind potential at school by using long-term climate...
National Wildlife Federation
I Speak for the Polar Bears!
Climate change and weather extremes impact every species, but this lesson focuses on how these changes effect polar bears. After learning about the animal, scholars create maps of snow-ice coverage and examine the yearly variability and...
Curated OER
Carbon Monoxide and Population Density
Tenth graders investigate the carbon monoxide level at a fixed latitude. They determine if there is a relationship to population density. They download data sets and generate a graph. They determine a link between human activity and...
Curated OER
Creating Climographs
Students use satellite data to compare precipitation and surface temperatures on different islands. In this satellite lesson students create graphs and explain the differences between weather and climate.
Curated OER
Put the Title of the Lesson Here
Eighth graders write a Compare and Contrast essay comparing the lives of similarly aged students at different Latitudes. They share their essays with epals, via e-mail. They may include digital photographs in their correspondence as well.
Curated OER
Is Portland, Oregon Experiencing Global Warming?
Students use data to determine if the climate in Portland has changed over the years. In this weather lesson students complete line graphs and study long wave radiation.
Statistics Education Web
What Percent of the Continental US is Within One Mile of a Road?
There are places in the US where a road cannot be found for miles! The lesson plan asks learners to use random longitude and latitude coordinates within the US to collect data. They then determine the sample proportion and confidence...
University of Colorado
Phases of Charon
Pluto, although no longer considered a planet, has five moons. Pluto's moon, Charon, is the focus of a resource that describes how the moon is viewed from the surface of Pluto. Photos help individuals see how Charon would look at...
Curated OER
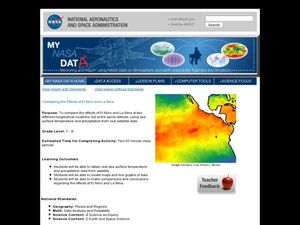
Comparing the Effects of El Nino and La Nina
Students examine the differences between an El Nino and La Nina year. In this investigative lesson students create maps and graphs of the data they obtained.
Curated OER
Solar Cell Energy Availability From Around the Country
Students determine areas that are the most likely to produce solar energy by using NASA data. In this solar energy instructional activity students analyze plots and determine solar panel use.
Curated OER
True North, Magnetic North
Students explain why compass angles need to be corrected for regional magnetic variation. They observe the difference between magnetic and true north. Each student measures the angle of variation for a town in a different state.
Curated OER
The Landscape of a Novel
Students, after reading a novel, utilize geographic skills to map out the places described in the novel. They collect data, envision spatial features and then design a map to work off of to complete their assignment. Each student also...
Curated OER
Earth's Energy Budget - Seasonal Cycles in Net Radiative Flux
Students attempt to understand seasonal variation by viewing images of the energy received by the earth. For this weather lesson, students view images from NASA of the influx of energy from the sun and make predictions about resulting...
Curated OER
Cold, Clouds, and Snowflakes
Young scholars explore satellite data and graphing. In this weather data analysis math and science lesson plan, students analyze NASA satellite data to draw conclusions about geographical areas where precipitation might have happened....
Curated OER
Differences Between Ground and Air Temperatures
Students examine the differences between air temperature and ground temperature. In this investigative instructional activity students find NASA data on the Internet and use it to create a graph.
Curated OER
Is Grandpa Right, Were Winters Colder When He Was a Boy?
Students compare current weather data to historic data to see if there is a temperature change. In this weather lesson students complete a lab activity and determine average changes in temperature, precipitation and cloud cover.
Curated OER
Radiation Comparison Before and After 9-11
Using the NASA website, class members try to determine if changes could be detected in cloud cover, temperature, and/or radiation measurements due to the lack of contrails that resulted from the halt in air traffic after the attacks...
Curated OER
Seasons Worksheet #1
First, your earth science pupils determine what season is depicted in a diagram of the tilted Earth as it receives radiation from the sun. They answer multiple choice questions about occurrences at different points on Earth in the...
Discovery Education
Physical Oceanography and Meteorology, Navy Search and Rescue Operation
It's an ocean rescue mission! Groups must find a pilot downed off the coast of the Chesapeake Bay. Rescuers must determine the distance needed to travel as well as the heading to get to the pilot's last known position. Taking...
Teach Engineering
Air Pollution in the Pacific Northwest
Scholars investigate levels of nitrogen dioxide in the Pacific Northwest by examining the role of nitrogen in air pollution and how remote sensing can be used to measure nitrogen levels. An Excel spreadsheet calculates the difference...
University of Southern California
What's the Catch?
There must be a catch! A comprehensive lesson looks at ocean fishing concerns through a set of five hands-on activities. Learners become aware of the risks of seafood contamination and factors that have affected the ocean environment.
Geography for Geographers
Five Themes of Iceland
How do the five themes of geography relate to the country of Iceland? Pupils learn about everything from the differences between relative and absolute location to how humans both adapt and change the environment. The presentation...
Curated OER
Where Do I Live?
Students gain a better understanding of the population of the region they live in by comparing U.S. census data on the internet.
Other popular searches
- Longitude and Latitude
- Longitude Latitude
- Latitude and Longitude Games
- Latitude and Longitude Maps
- Longitude & Latitude
- Longitude and Latitude Game
- Longitude and Latitude Math
- Geography Latitude Longitude
- Whaling Latitude Longitude
- Longitude Latitude Minutes
- Longitude and Latitude Lines
- Volcano Latitude Longitude


