Curated OER
Radon Alert: Understanding Odds
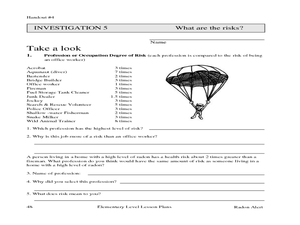
In this radon alert: understanding odds worksheet, 5th graders predict results of rolling dice and record data in a chart, then compare odds of events and occupations, then compare that with radon exposure.
Curated OER
Lines of Best Fit
Students determine if there is an associationm in a scatter plot of data. They analyze data through predictios, comparisons, and applications. Students calculate the line of best fit using a graphing calculator. They display data in...
Curated OER
File Card Bridges
Students make different variations of file card bridges and predict how much weight it will hold. In this file card bridges lesson plan, students put file cards between books in different ways and predict how many pennies it will hold.
Howard Hughes Medical Institute
The Teosinte Hypothesis
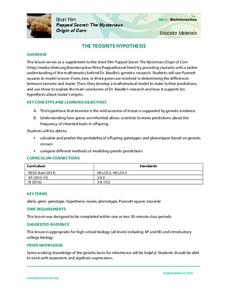
Don't want to sound corny, but your class will be a-maize-d by an engaging activity! Explore the history of the modern corn plant through a video and Punnett squares. Junior genetics experts get hands-on experience with actual research...
Curated OER
M&M Graphing
Youngsters sort M & M's by color. They graph the M&M's by color on a graph. This classic lesson is a wonderful way to introduce the concept and technique of graphing to young mathematicians. Pairs of kids can make up their own...
Curated OER
Drive the Data Derby
Three days of race car design and driving through the classroom while guessing probability could be a third graders dream. Learn to record car speed, distances traveled, and statistics by using calculation ranges using the mean, median,...
Curated OER
Marble Mania
Students explore the concept of probability. In this probability lesson, students develop an understanding of probability by pulling marbles out of a bag and recording the data. Students use the recording sheet to discuss the results of...
Curated OER
Using the Landscape Picture Map to Develop Social Studies Skills
Enhance your class' geography skills using this resource. Explore a variety of concepts including production and distribution, and people and the environment. Learners make predictions and identify locations on maps. This is a creative...
Albert Shanker Institute
Economic Causes of the March on Washington
Money can't buy happiness, but it can put food on the table and pay the bills. The first of a five-lesson unit teaches pupils about the unemployment rate in 1963 and its relationship with the March on Washington. They learn how to create...
Curated OER
Probability
Fourth graders predict future outcomes with an investigation of the mathematical principle of probability using spinners constructed by them. The spinner is a hands on application an they combine it with writing a ratio for the...
Curated OER
Probability
Sixth graders explore probability. They analyze a class chart and list the letters of the alphabet according to frequency. Using the data collected, they complete probability problems.
Curated OER
Exploring Probability
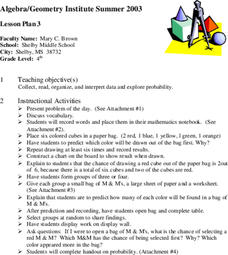
Fourth graders participate in a lesson that explores probability. They use candy and model cubes to experiment with different outcomes that can be charted if the students can proceed to the objective of the lesson. They discover how...
Curated OER
You May Already Be a Winner!
Second graders flip coins and tally the outcomes. They play the You May Already Be a Winner! game with cards under their chairs. Some cards are winners, some might be and the others are not. They play to explain the probability concept.
Curated OER
Calculating Theoretical & Experimental Probability
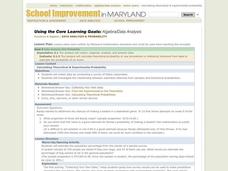
Students explore the concept of experimental and theoretical probability. In this experimental and theoretical probability lesson, students collect data by conducting a survey of their classmates. Students compare their data and discuss...
Curated OER
Probability: Playing with Fire
Students use probability to determine how likely it is for each tree in a small forest to catch on fire.
Curated OER
ng Data: Probability, What's in the bag?
Learners use the language associated with probability to discuss events including those with equally likely outcome. They collect data from a simple experiment and record in a frequency table: estimate probabilities based on this data
US Department of Agriculture
Sink or Float?
Will it sink or will it float? Learners predict the outcome as they drop random objects into a container of water. Then, they keep track of the results and record the data in a t-chart to draw a final conclusion.
Virginia Department of Education
May I Have Fries with That?
Not all pie graphs are about pies. The class conducts a survey on favorite fast food categories in a instructional activity on data representation. Pupils use the results to create a circle graph.
Novelinks
Walk Two Moons: Story Impressions
Story chains connect literary concepts, reinforce context clues, and even help learners predict what's coming next! Using words from the next chapter of Sharon Creech's Walk Two Moons, middle schoolers craft story chains to...
Howard Hughes Medical Institute
Gorongosa: Scientific Inquiry and Data Analysis
How does the scientific process begin? Introduce ecology scholars to scientific inquiry through an insightful, data-driven lesson. Partners examine data from an ongoing research study to determine the questions it answers. The resource...
Curated OER
What's the Chance?
Students study probability and statistics by conducting an experiment, recording their results, and sharing data with classmates.
Curated OER
Graphing Activity
In this probability and statistics worksheet, learners work with a family member to construct graphs based on real life data. The two page worksheet contains three questions. Answers are not included.
Curated OER
Flip a Coin
Students are introduced to the concept of probability. In groups, they make a prediction about how many times a coin might show heads or tails when flipped. They carry out the experiment and record their results to compare it to their...
Curated OER
Coin Drop
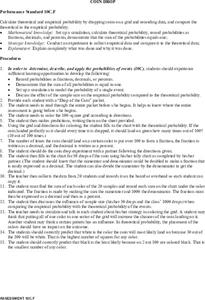
Students calculate the theoretical and empirical probability by dropping coins on a grid. They record their data and compare the theoretical and empirical data. Students make predictions about the results before conducting the experiment.


