CK-12 Foundation
Multiple Bar Graphs
I scream, you scream, we all scream for ice cream bar graphs. Pupils create a multiple bar chart to represent the sales of ice cream products during the first week of summer. Using the chart, learners find the day that each of the...
Curated OER
Create a Graph Online
Scholars create colorful bar, line, or pie graphs. They decide on a survey question to ask or a type of data to gather. From there, they collect information and data. They display this data in bar, line, or pie graphs that they create...
World Wildlife Fund
Graphs and Charts
A two-part worksheet incorporating bar graphs and pie charts, young mathematicians can practice their graphing skills. Pupils answer questions using graphs and charts but are also challenged to create their own using a given set of data.
Baylor College
Air: The Math Link
Inflate this unit on the science of air with these math skills practice and word problems. Accompanying the children's story Mr. Slaptail's Secret, this resource covers a wide range of math topics including the four basic...
Pace University
Grade 7 Earth Day Statistics with Circle and Bar Graphs
Take a tiered approach to studying waste. The lesson uses Earth Day to present differentiated instruction around using circle and bar graphs. Each group gets a cube based on their tiers and works collaboratively as well as individually...
Curated OER
Learning to Read Graphs
What is your favorite pet? This is a great tool for youngsters just learning how to read and interpret graphs. There are four simple questions. Consider extending this activity by creating a class bar graph: how many learners have a dog,...
Curated OER
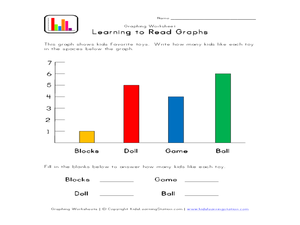
Learning to Read Graphs 2
Do you like playing with blocks, dolls, games, or balls? Use this basic graph to review bar graphs with young learners. After completing the four questions below, consider creating your own class graph: who likes blocks the best? Who...
Curated OER
Data Collection
Students write a journal exercise that relates to pets. They collect information from each other in order to practice making and interpreting bar graphs. They Continue building different kinds of graphs with the group.
Curated OER
Likely Outcomes
A coin toss is a simple and fun way to help youngsters discovery probability. Preferably in partners, they first predict what would happen if they tossed two coins 48 times. How often would two heads show up? Two tails? How about one of...
Curated OER
Data and Probability: What is the Best Snack?
In this math/nutrition lesson, the nutritional value of 3 snack foods is recorded on a data chart and represented on a bar graph. Learners analyze and compare information, construct data charts and related bar graphs, and draw...
Curated OER
Bar Graphs
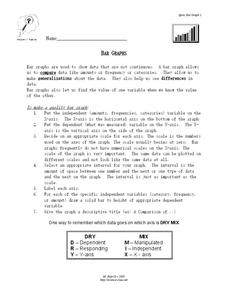
In this bar graph worksheet, learners read about making quality bar graphs and they make a bar graph using given data. They answer 5 questions about their graph.
Scholastic
Study Jams! Choosing the Correct Graph
With so many types of graphs, don't let your learners get stuck figuring out which one to use. To track how Zoe spent her allowance, use this interactive lesson to review all the types of graphs and pick the best one to display the data....
Curated OER
Olympic Bar Graphs
In this Olympic bar graph worksheet, students pick a sport from the 2004 Olympic games and find data from the Olympic web page. They graph the scores (times, distance, or speed) and the medals. They answer questions about the variables...
Curated OER
Histograms and Bar Graphs
Students examine the use of bar graphs and histograms. For this data representation lesson, students investigate the proper use of bar graphs and histograms to represent data. They learn the proper geometric definitions, experience...
Curated OER
Fast Food Survey Using Bar Graphs
Second graders create a bar graph to pictorically represent the data collected from a survey of students. They use Excel to electronically create the graphs and data tallies. They then interpret their data using sentences to explain.
Curated OER
Interpreting a bar chart
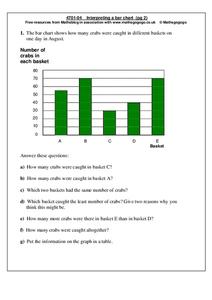
In this bar chart worksheet, students analyze a bar chart and answer 7 questions pertaining to the information on the chart. The answers are on the second page.
Curated OER
Double Bar Graphs (Reteach 15.1)
In this graphs worksheet, learners analyze the data on two double bar graphs. Students answer 4 questions about the information on the graphs.
Curated OER
Cosmic Bar Graphs
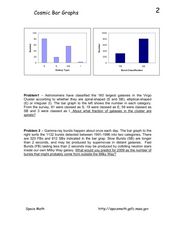
For this cosmic bar graph worksheet, students solve 2 problems using given bar graphs that plot the number of galaxies vs. the galaxy type and the number of gamma-ray bursts vs. the burst classification. Students find the fraction of...
Curated OER
Frequency, Histograms, Bar Graphs and Tables
In this frequency learning exercise, students interpret histograms, bar graphs and tables. They examine frequency charts and comparison line graphs. This three-page learning exercise contains 4 problems. Answers are...
Curated OER
Integrated Algebra Practice: Frequency Histograms, Bar Graphs and Tables
In this graphs activity, students solve 4 problems about histograms, bar graphs, and tables. Students answer questions about histograms, bar graphs, and tables.
Math Mammoth
Bar Graphs 1
In this bar graph activity, students organize data in a frequency table, then create a bar graph. They find the average of the data. This one-page activity contains two multi-step problems.
Curated OER
Bar Graphs
Third graders investigate bar graphs. In this third grade mathematics lesson, 3rd graders collect and analyze data and use the internet’s Graph challenge to create their own graphs. Students write questions for the other...
Curated OER
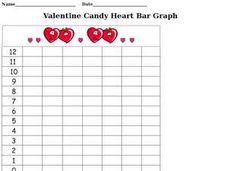
Valentine Candy Heart Bar Graph
In this Valentine candy heart bar graph worksheet, students complete a bar graph illustrating how many different colored candy hearts they received for Valentine's Day.
Curated OER
How Do You Like To Eat Your Apples?-- Class Bar Graph
In this math worksheet, students collaborate as a group to plot data pertaining to their favorite ways to eat apples: sliced, pie, whole, sauce, caramel or muffin. Students record their class data on the bar graph.
Other popular searches
- Skittles Bar Graph
- Double Bar Graphs
- Bar Graphs Pictographs
- Histogram and Bar Graph
- Bar Graphs and Histograms
- Bar Graph Problem Solving
- Favorite Food Bar Graph
- Bar Graphs Histograms
- Interpreting Bar Graphs
- Bar Graphs for Birthdays
- Bar Graph Worksheet
- Bar Graphs and Charts


