Illustrative Mathematics
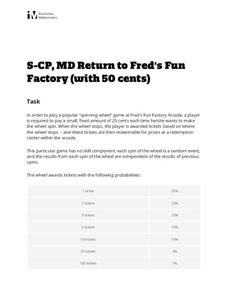
Return to Fred's Fun Factory (with 50 Cents)
The penny arcade gets the statistics treatment in this fun probability investigation. A non-standard game of chance is described and then the class is set loose to find missing probabilities, determine common outcomes, and evaluate...
Balanced Assessment
A Fishy Story
There's nothing fishy about this resource. In the task, learners use given information about fish prices to create a scatter plot and line of best-fit. Later, they use the information to answer questions about the profit from fish sales.
Curated OER
El Salvador: Whose Breakfast Isn't for the Birds?
Sixth graders investigate the understanding of where coffee is grown by conducting a survey. They study the natural history of coffee and examine bird habitats in the areas where coffee is grown. They write letters to explaining the...
Curated OER
Shaquille O'Neal Hand/Foot Span
Shaquille O'Neal has huge hands and feet, and learners will use those two measurements to practice collecting and extrapolating data using ratios. They record the measurement of foot and hand span of several of their classmates, then...
Curated OER
Point Reflection
Use this task as an exit ticket for your eight graders during the geometry unit. All they need to do is identify the coordinates of a point reflected over y=2000.
University of Utah
Simultaneous Linear Equations
Solve simultaneous linear equations, otherwise known as systems of linear equations. Pupils practice solving systems of linear equations by graphing, substitution, and elimination. The workbook provides a class activity and homework...
EngageNY
Using a Curve to Model a Data Distribution
Show scholars the importance of recognizing a normal curve within a set of data. Learners analyze normal curves and calculate mean and standard deviation.
Illustrative Mathematics
Identifying Quadratic Functions
Put your high schoolers to the test and see how well they know their quadratic functions. With excellent thought-provoking questions, learners use what they know about creating quadratic equations based off different pieces of...
Illustrative Mathematics
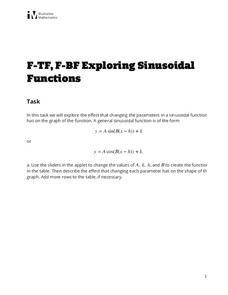
Exploring Sinusoidal Functions
What effect does changing a parameter have on the graph of a trigonometric function? Pupils use a Desmos applet to explore the general sine graph. They experiment changing different parameters and record the resulting change of the...
Curated OER
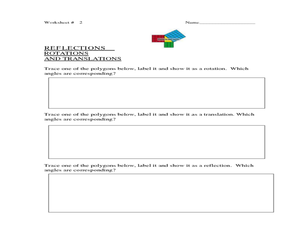
Point Comparisons
Young geometers investigate two-dimensional figures using coordinate grids. They identify polygons and draw examples of their reflection, rotation, and translation on a coordinate grid. And they complete a worksheet practicing examples...
Curated OER
The Art of Interpreting Percent
Ddefine the relationships between fractions, decimals, and percentages in a series of lessons. The class practices converting between these three versions of a number. They also find the common factor of a numerator and denominator and...
Statistics Education Web
What Does the Normal Distribution Sound Like?
Groups collect data describing the number of times a bag of microwave popcorn pops at given intervals. Participants discover that the data fits a normal curve and answer questions based on the distribution of this data.
Curated OER
Parabolas and Inverse Functions
Your Algebra learners will explore what equations are functions or not functions and how to alter the domain to produce a possibility for the relations being a function with a limitted domain.
Curated OER
Why Does ASA Work?
Your geometry learners explore Angle-Side-Angle congruence in this collaborative task. The sum of the interior angles of all triangles being one hundred eighty degrees, is the key learners will discover as they explain their reasoning...
West Contra Costa Unified School District
Talking About Distance, Rate and Time
Connect the tortoise and the hare fable to mathematics. Learners first identify key terms related to distance, rate, and time. They then solve distance/rate/time problems using different representations.
PBL Pathways
Medical Insurance 2
Make an informed decision when choosing a medical insurance provider. An engaging lesson asks your classes to write piecewise models to represent the cost of different medical plans. The project-based learning activity is a variation of...
Shodor Education Foundation
Normal Distribution
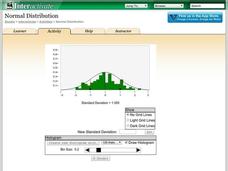
Does the size of the bin matter? The resource allows pupils to explore the relationship between the normal curve and histograms. Learners view histograms compared to a normal curve with a set standard deviation. Using the interactive,...
College Board
Why Variances Add - And Why It Matters
Why is adding variance important? A lesson outline defines a variance theorem and how it affects the data statistics. The instruction shows scholars the importance of considering the variance of data and why it requires independence.
Curated OER
School Yard Waste
Fourth graders examine the types of garbage that they collect on the playground. They collect the information in a spreadsheet and create a graph that displays the number of types of trash found. They design and monitor a playground...
Curated OER
Polynominoes
For this polynominoes worksheet, students solve 9 different types of polynominoes problems. First, they identify that a polynominoe is a polygon made from squares of the same size and connected to each square. Then, students determine...
Curated OER
Scatter Diagrams and Curve Fitting
In this Scatter Diagrams and Curve Fitting worksheet, students are guided in how to graph a scatter diagram (plot) and a Best Fit Line using a TI-83 graphing calculator.
Curated OER
Using Numbers Everywhere
Kindergarteners explore various representations and uses of numbers to develop number sense. They participate in an activity and arrange patterns into groups. Students compare the sets and describe the objects in each set.
Curated OER
Functions
In this algebra worksheet, students look at 4 sets of relations and determine if they are functions. Students are provided with the graphs of three functions and determine the function value. Two relations are graphed on the coordinate...
Illustrative Mathematics
Finding a Chair
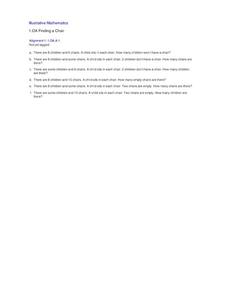
Here is an activity that incorporates subtraction in word problems. Youngsters are provided with six word problems that essentially deal with the same numbers in each problem, yet use different comparison language. These problems are...


