EngageNY
Connecting Graphical Representations and Numerical Summaries
Which graph belongs to which summary statistics? Class members build upon their knowledge of data displays and numerical summaries to connect the two. Pupils make connections between different graphical displays of the same data in the...
Curated OER
Connect the Mathematical Dots
Teachers can choose visual activities that demonstrate the elegance associated with the coordinate plane.
Balanced Assessment
Red Dots, Blue Dots
Count the connections between dots. Young mathematicians come up with a method to determine the number of connections between pairs of dots. The assessment leads the class to determine the connections they can make when groups are...
Illustrative Mathematics
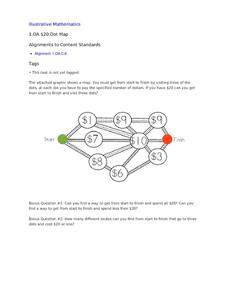
$20 Dot Map
Challenge the addition skills of young learners with this open-ended math problem. The task is simple, get from start to finish by connecting a series of three numbers. The trick is that the sum of the numbers must be less than or equal...
EduGAINs
Data Management
Using a carousel activity, class members gain an understanding of the idea of inferences by using pictures then connecting them to mathematics. Groups discuss their individual problems prior to sharing them with the entire class. The...
EngageNY
Understanding Box Plots
Scholars apply the concepts of box plots and dot plots to summarize and describe data distributions. They use the data displays to compare sets of data and determine numerical summaries.
EngageNY
Sampling Variability and the Effect of Sample Size
The 19th installment in a 25-part series builds upon the sampling from the previous unit and takes a larger sample. Pupils compare the dot plots of sample means using two different sample sizes to find which one has the better variability.
EngageNY
Distributions and Their Shapes
What can we find out about the data from the way it is shaped? Looking at displays that are familiar from previous grades, the class forms meaningful conjectures based upon the context of the data. The introductory instructional activity...
EngageNY
Expected Value of a Discrete Random Variable
Discover how to calculate the expected value of a random variable. In the seventh installment of a 21-part module, young mathematicians develop the formula for expected value. They connect this concept the dot product of vectors.
Florida Center for Instructional Technology
A Human Number Line: Teacher Notes
Twenty-one pieces of tagboard can lead your class to a greater understanding of integers when you use them to form a human number line. After creating this math tool, two strategies for adding and subtracting will have your...
EngageNY
Describing the Center of a Distribution
So the mean is not always the best center? By working through this exploratory activity, the class comes to realize that depending upon the shape of a distribution, different centers should be chosen. Learners continue to explore the...
Curated OER
Seeing Dots
Your algebra learners interpret algebraic expressions, in order to compare their structures, using a geometric context. They also discern how the two expressions are equivalent and represent a pattern geometrically and algebraically.
Teach Engineering
Quantum Dots and the Harkess Method
The Fantastic Voyage is becoming close to reality. The class reads an article on the use of nanotechnology in the medical field and participate in a discussion about what they read. The discussion method helps class members become more...
TLS Books
Dot-to-Dot Puppy
Connect the dots to complete a huge puppy! What preschooler or kindergartener wouldn't find such a task rewarding? The dots are numbered from 1 to 30, so this will definitely meed Common Core counting and cardinality standards for...
Curated OER
Making Connections
Eighth graders investigate the input/output model for building function tables. From the data, 8th graders connect tables, graphs, function rules, and equations in one variable. They work backwards to determine function rules for given...
EngageNY
Measuring Variability for Symmetrical Distributions
How do we measure the deviation of data points from the mean? An enriching activity walks your class through the steps to calculate the standard deviation. Guiding questions connect the steps to the context, so the process is not about...
Curated OER
Connecting The Dots: Activities/Interests to Careers
Second graders complete the first and second sections of the Activity Sheet "New Things To Learn and Explore." They identify the Career Path that link them to careers using the link between those activities and interests. Students think...
Curated OER
Connecting the Dots: Workers and Their Importance
Students explore the role of workers and their jobs in the community. They write a friendly letter to a community worker expressing appreciation for the work they do and their importance to the community.
Teachers Network
A World of Symmetry: Math-Geometry
Define and identify the three basic forms of symmetry translation, rotation, and glides with your class. They cut out and arrange paper pattern blocks to illustrate symmetry, create a Cartesian graph, and design a rug with a symmetrical...
Curated OER
Counting Mat
Using the provided counting mats (1-6 and 7-12) and small objects to count with, guide your young learners to match the correct number of objects to the written numeral and dots. Class members will either read the numeral and count out...
Mathematics Vision Project
Module 1: Sequences
Sequences are all about recognizing patterns. A module of 11 lessons builds pupils' understanding of sequences through pattern analysis. The practice connects the analysis to linear and exponential equations. This is the first module in...
Mathematics Vision Project
Module 9: Modeling Data
How many different ways can you model data? Scholars learn several in the final module in a series of nine. Learners model data with dot plots, box plots, histograms, and scatter plots. They also analyze the data based on the data...
Mathematics Assessment Project
Octagon Tile
A connecting-the-dots activity seems too easy for seventh grade but connecting vertices may prove a challenge. Class members first examine a figure created by drawing squares around the inside of an octagon and connecting the vertices....
National Council of Teachers of Mathematics
Eruptions: Old Faithful Geyser
How long do we have to wait? Given several days of times between eruptions of Old Faithful, learners create a graphical representation for two days. Groups combine their data to determine an appropriate wait time between eruptions.


