Curated OER
A Holiday Calendar in MS Publisher for Elementary School
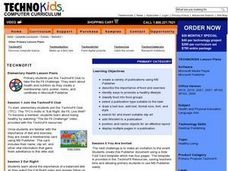
Students create a holiday calendar using ms word. In this technology lesson, students create their own calendar while learning basic Publisher skills. Students use clipart, explore how to change fonts, and how to use templates.
Curated OER
Probability using M & M's
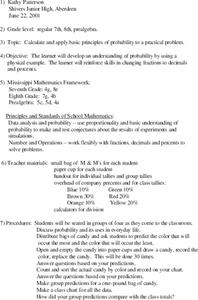
Using M & M's candies, young statisticians predict the color distribution in a packet of candies and test their predictions against their group and the larger class. A review of converting between fractions, decimals, and percents...
Curated OER
Comparing M & M's
In this comparing worksheet, 2nd graders count up the numbers of different colored m & m's and then answer questions about comparing each color. Students complete 4 questions.
Curated OER
The Three M's of Statistics: Mode, Median, Mean
Young mathematicians use the Visual Thesaurus to define mean, median, and mode. For this mean, median and mode lesson, learners use online sources to find the definitions of mean, median, and mode before applying the concepts to a class...
Scholasic
The Magic School Bus and the Missing Tooth
We chew with our teeth every day, but how much do we really know about them? Allow Ms. Frizzle to teach your kids a thing or two about teeth. Kids complete a prereading exercise, read the book, and respond to several prompts about the...
Curated OER
Need a House? Call Ms. Mouse!
First graders are read many books and they are to make a poem, write a story, or perform some other activity showing their understanding of how environments function.
American Psychological Association
A Tasty Sample(r): Teaching about Sampling Using M&M’s
Here's a sweet activity! As part of a study of psychological research methods and statistic gathering, individuals develop a hypothesis about the number of each color of M&Ms in a fun-size package. They then count the number of each...
Curated OER
MS Math Multiplying Fractions
Students investigate the concept of fractions using the application of a word problem. The concept is taught by giving a word problem that needs to be solved. The lesson requires strong reading comprehension and logical thinking skills.
Education Development Center
Integer Combinations—Postage Stamps Problem (MS Version)
Number patterns can seem mysterious. Help your learners unravel these mysteries as they complete an intriguing task. Through examination, collaborative groups determine that they are able to produce all integers above a certain...
American Museum of Natural History
Being a Zoologist: Sandra Olsen
Are your students wild about horses? Then introduce them Sandra Olsen, a zooarchaeologist, who has been studying horses and the people who herd them. Ms Olsen responds to 15 interview questions and details how she goes about her...
Stats Monkey
Everything I Ever Needed to Learn about AP Statistics I Learned from a Bag of M and M's®
Candy is always a good motivator! Use this collection of M&M's® experiments to introduce statistics topics, including mean, standard deviation, nonlinear transformation, and many more. The use of a hands-on model with...
Statistics Education Web
Population Parameter with M-and-M's
Manufacturers' claims may or may not be accurate, so proceed with caution. Here pupils use statistics to investigate the M&M's company's claim about the percentage of each color of candy in their packaging. Through the activity,...
American Chemical Society
Dissolving M-and-Ms
Learning ... how sweet it is! A hands-on lesson uses colored candies to demonstrate how positive and negative charges interact. Pupils use different types of liquids and watch as the color from the candies spreads—or doesn't.
Curated OER
Healthy Lifestyles
Students navigate MS Publisher to create a publication about a healthy lifestyle. In this healthy lifestyle lesson, students participate in activities to learn to eat right, to be fit and to create a publication based on what they...
Curated OER
What's Your Shoe Size? Linear Regression with MS Excel
Learners collect and analyze data. In this statistics instructional activity, pupils create a liner model of their data and analyze it using central tendencies. They find the linear regression using a spreadsheet.
Curated OER
Bungee M&M's
Science is exciting - and delicious! Pairs of learners set up a bungee cord type of experiment. They use buckets filled with M & M's, a meter stick, and a Slinky spring (as the bungee) to conduct their experiment. A good activity...
Curated OER
Beginning Graphs in MS Excel
Young scholars practice creating graphs in Microsoft Excel. In this technology lesson, students conduct a random survey and collect data. Young scholars use the Microsoft Excel program to create a bar graph of the data.
Curated OER
MS Word Skills Assessment
Students are assessed on their use of the Microsoft Word program. In this word processing assessment, students are asked to complete a list of tasks in the Microsoft Word program to determine their knowledge of the program.
Curated OER
Earthling Names
Young readers learn from this presentation the proper ways of capitalizing and punctuating "titles," such as: Mr., Mrs. Ms. Capt., etc. The last slide has four titles of people that students must correctly capitalize and punctuate.
Global Oneness Project
The Importance of Indigenous Language Revitalization
Middle schoolers consider languages as representations of cultures and the importance of preserving various languages, especially the rapidly disappearing languages of indigenous peoples, in a lesson that tells the story of Marie Wilcox...
Curated OER
Explore Learning Exponential Functions
High schoolers graph exponential equations and solve application problems using exponential functions. They re-enact a story about a peasant worker whose payment for services is rice grains doubled on a checker board. They place M &...
Curated OER
M&M's and the Scientific Method
Sixth graders explore the scientific method by conducting an in class experiment. In this scientific averages lesson, 6th graders discuss the concept of the scientific method, and define the different mathematical averages, mean, median...
Curated OER
Using MY NASA DATA to Determine Volcanic Activity
Students explore how aerosols are used in science to indicate volcanic activity and how biomass burning affects global aerosol activity. Students access data and import into MS Excel using graphical data to make inferences and draw...
Curated OER
Show Me The Data!
Pupils create a bar graph. They will collect and organize data to turn into bar graphs. They create graphs for the favorite sports of the class, color of M&M's, and types of cars passing by.
Other popular searches
- Ms Word
- M &Amp; Ms
- M&ms
- Ms Publisher 2003
- Ms Publisher
- Ms Word 2003
- Ms Paint
- Ms. Usa
- Ms Access
- Ms Word Tables
- Desktop Publishing Ms Word
- M&m's


