Curated OER
High or Low- Probability
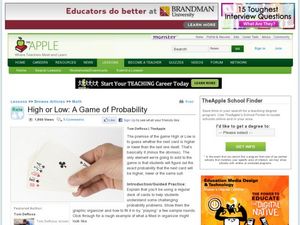
Students use playing cards to examine probability. In this probability lesson, students work in groups with a deck of cards and predict if the next card they lay down will be high or low. Students fill out a graphic organizer with their...
Curated OER
Percents, Decimals, and Fractions
In this Algebra I activity, 9th graders convert percentages to decimals and fractions. The one page interactive activity contains ten problems. Answers and a hint are provided.
Curated OER
Pay Check Advance Loan
Students research loans. In this financial lesson, students explore the benefits and drawbacks of applying for a pay-day advance loan. Students compare different programs and calculate interest owed. Multiple resources are provided.
Curated OER
Estimate on a Number Line
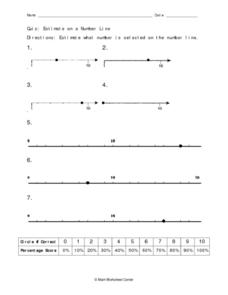
Using a number line worksheet, learners solve seven different problems using the shown number line in each. They estimate what number is selected on the number line in each problem and write it out.
PBS
Waste Audit
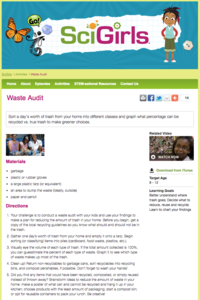
Does everything in the trash can belong there? Conduct a waste audit with your class by collecting a day's worth of garbage, separating it into recyclables, non-recyclables, or food waste, and properly distributing what they find into...
Mathematics Assessment Project
Ice Cream
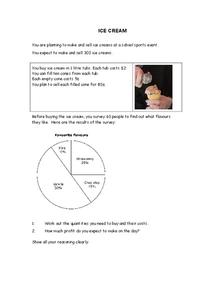
I scream, you scream, we all determine the amount of ice cream! Pupils calculate the amount of ice cream flavors needed based on survey results in a short summative assessment. They determine the number of tubs and cost of ice cream to...
National Wildlife Federation
How Many Bison?
Math and science to the rescue! Some basic math concepts help scientists predict wildlife populations. Using tokens, groups simulate tagging a wildlife population. They then use proportions to estimate the population of the wildlife.
National Wildlife Federation
Fish and Ladders: Grades 5-8
Swim with the fishes. Learners simulate the migration of Chinook salmon. Groups pretend to be salmon, while others are predators, fishers, and hazards. The salmon start in the spawning area and swim downstream to the ocean until reaching...
Teach Engineering
Enough Energy? Play the Renew-a-Bead Game
Pairs simulate the energy usage of different countries by drawing beads from a bag, which contain different beginning ratios of non-renewable and renewable energy resources. The activity concludes with a series of questions to tie the...
PBS
Pass the Past
Prepare your class members for history and geography exams with an educational game that not only tests content knowledge, but also requires students to demonstrate their reading comprehension skills.
Mind Snacks
Learn Italian - MindSnacks
Once your class samples these games, they won't want to stop learning Italian. Eccellente! Effective for beginning and intermediate Italian learners, picking up new words and phrases through this app is an entertaining task.
Hello-Hello
Spanish – Learn Spanish (Hello-Hello)
Pick up basic conversational Spanish with animated videos featuring three characters: Pablo, Ana, and Marcos. As Pablo and Marcos get to know Ana, they talk about a variety of subjects. Learners can acquire the vocabulary in each...
Geography 360°
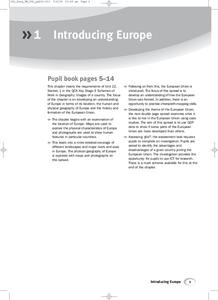
Introducing Europe
Provide your learners with a comprehensive introduction to Europe with this great set of worksheets. Map activities include matching European countries to their capitals and places on a political map, as well as exploring different...
EngageNY
Comparing Distributions
Data distributions can be compared in terms of center, variability, and shape. Two exploratory challenges present data in two different displays to compare. The displays of histograms and box plots require different comparisons based...
PBIS World
Daily Check In Check Out Data Summary
Compile data for a child's IEP with a helpful summary worksheet. With formulas for calculating the assessment information you need, it's a great addition to checking on your learners' progress.
Math Drills
Christmas Word Problems
Solve 10 festive word problems during the holiday season! Santa and his team need your class's help to decorate, sort toys, organize reindeer, and bake toffee with multiplication and division skills.
Balanced Assessment
Chance of Rain
Will it rain during the weekend? Pupils become meteorologists for a day as they use the assessment to determine the chance of rain for Saturday and Sunday. Class members interpret the weather statements as they pertain to probabilities...
EngageNY
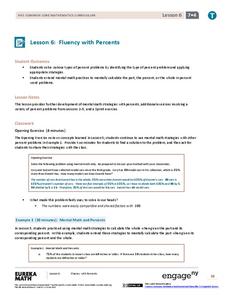
Fluency with Percents
Pupils build confidence working with percents as they work several types of percent problems to increase their fluency. The resource contains two sets of problems specifically designed to build efficiency in finding solutions of basic...
EngageNY
Tax, Commissions, Fees, and Other Real-World Percent Problems
Pupils work several real-world problems that use percents in the 11th portion of a 20-part series. The problems contain percents involved with taxes, commissions, discounts, tips, fees, and interest. Scholars use the equations formed for...
EngageNY
Grade 9 ELA Module 4, Unit 1, Lesson 10
What can consumers do to pressure companies to produce "ethically manufactured goods"? Readers examine the evidence Amy Odell uses in the supplemental text "How Your Addiction to Fast Fashion Kills" to support her argument and her...
Prestwick House
New (March 2016) SAT Reading Test Practice
The SAT. The ACT. AP exams. The very mention of these exams can cause the college bound to feel anxious. One way to combat Test Anxiety is to provide high schoolers with models of these tests and give them opportunities to analyze the...
CK-12 Foundation
Interpretation of Circle Graphs: Northwest Region Population Pie
Given populations of the five Northwestern states, learners create a circle graph. Using the data and the pie chart, they make comparisons between the populations of the states. Finally, the pupils determine how the chart will change...
CK-12 Foundation
Types of Data Representation: Baby Due Date Histogram
Histograms are likely to give birth to a variety of conclusions. Given the likelihood a woman is to give birth after a certain number of weeks, pupils create a histogram. The scholars use the histogram to analyze the data and answer...
Concord Consortium
Temperature and Reaction Rate
Does increasing temperature increase the rate of a chemical reaction? Junior chemists examine the effects of temperature on reaction rate using an engaging interactive. Pupils select the temperature of the reaction vessel, then observe...
Other popular searches
- Teaching Percentages
- Figuring Percentages
- Calculating Percentages
- Basic Money Percentages
- Math Percentages
- Markup Percentages
- Discount Percentages
- Decimals and Percentages
- Percentages and Math
- Math Lessons on Percentages
- Circle Percentages
- Percentages of Quantities


