Curated OER
Tree Comparison/Contrast Project
In this trees worksheet, students put different kinds of trees into a chart and compare and contrast them. Students then answer percentage problems about the trees and short answer questions. Students complete 7 questions in all.
Curated OER
Percent Problems
In this statistics worksheet, students find the percentages of the five given numbers. There is one problem where the students must find the percent of a fraction.
Curated OER
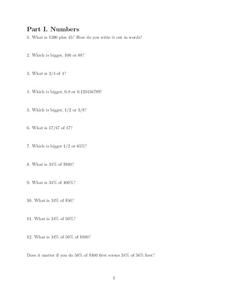
Numbers
In this interest worksheet, students calculate interest and percentages of numbers in number and word problems. Students complete 29 problems.
Curated OER
Find the Correct Order
By selecting a number in each of three columns to create a series of numbers arranged from least to greatest value, students will apply correct order rules. Slides include practice of ordering 3 and 4 digit numbers, fractions, mixed...
Curated OER
Stock Charting: Percentages and Profits
Students discuss and use a formula to calculate "Percent of Change." They duscuss the stock market and ways reports are quantified. Students watch as the teacher demonstrates how to create a spread sheet to calculate changes of a...
Curated OER
Percentages
In this algebra worksheet, students convert fractions to percents and take the percent of mixed numbers and whole numbers. There are 14 percent questions on this worksheet.
Curated OER
Percent of a Number
In this percent of a number worksheet, students solve percentage problems. They find the percent of a number, or identify a missing number when given the percent. This one-page worksheet contains ten problems.
Curated OER
Lab: Percent of Composition of KClO3
Students find the percent of oxygen in potassium chlorate. In this percent composition lesson plan, students heat a solution of potassium chlorate using a catalyst, manganese dioxide, to decompose the potassium chlorate and release...
Curated OER
Valentine Marbles
if you've ever had to guess how many items were in a jar, then this problem is for you! With a big jar full of red and white marbles, does picking a sample of 16 allow your learners to get a good estimate on the percentages of each...
Curated OER
Calculating Simple Interest
For this math worksheet, students investigate the concept of paying interest on a loan. Students read 10 problems where they look at a picture of something they are going to buy at a certain price and interest rate. Students calculate...
Curated OER
BMI: Body Mass Indicator
Students discover their body weight and composition. In this health lesson, students use a body mass indicator to identify their percentage of body fat. Students develop an exercise plan and record progress throughout a month.
Curated OER
Cereal Box Redesigns
Learners examine cereal boxes for nutrition information. In this nutrition lesson, students redesign cereal boxes to reflect their nutritional value. Learners understand that some cereals contain too high a percentage of sugar...
Curated OER
Dragon Genetics ~ Independent Assortment and Genetic Linkage
Imagine a pair of dragons that produce offspring. What percentage of the hatchlings have wings and large antlers? An engaging activity draws genetics learners in, introduces them to alleles, meiosis, phenotypes, genotypes, and...
The New York Times
Fiction or Nonfiction? Considering the Common Core's Emphasis on Informational Text
Nothing aids in comprehension more than an explanation and understanding of why things are done. Address why the Common Core requires the reading percentages that it established and analyze how this affects your readers. Learners read...
Center Science Education
Paleoclimates and Pollen
Demonstrate for your earth scientists how plant pollen of the past has become part of sedimentary deposits, providing clues about ancient climates. Then give them simulated sediment layer samples to analyze for different types of paper...
Curated OER
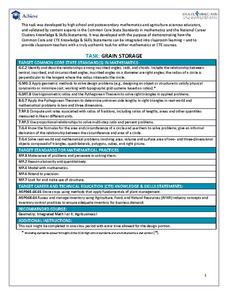
Task: Grain Storage
Farming is full of mathematics, and it provides numerous real-world examples for young mathematicians to study. Here, we look at a cylinder-shaped storage silo that has one flat side. Given certain dimensions, students need to determine...
Illustrative Mathematics
The Marble Jar
A jar is filled with 1,500 marbles and customers of a bank can enter a contest to guess the correct percentage of blue marbles. How can an employee at the bank estimate the actual percentage without physically counting all 1,500 marbles?...
CCSS Math Activities
Golf Balls
Land on the green with a fun resource. A short performance task asks pupils to consider the volume of containers that hold golf balls. They determine the percentage of empty space of the container for different numbers of golf balls.
Curated OER
# 18 Gas Chromatography: Introduction and Application
Young scholars are introduced to a gas chromatography using a discovery-based approach. They are presented with a scenario/industrial application where their job is to verify that the company's mouthwash contains a specific percentage of...
Curated OER
M&Ms Count and Crunch
Students practice skills involving statistics and probability by making predictions on number of each color candy in one pound bag of M&Ms. They record both guesses and actual quantities, calculate percentages, and create bar graphs...
Curated OER
Bar Graphs and Survey Questions- Internet Access
In this graphing and data collection activity, students examine a bar chart that show data collected from 1998 - 2006 that shows the percentage of households that have Internet access. They answer questions based on the chart and make...
Curated OER
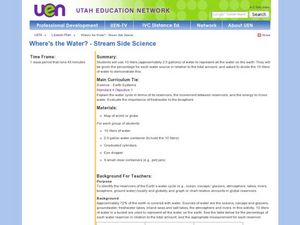
Where's the Water? Stream Side Science
After a whole-class discussion of water reservoirs, ten liters of water are given to each lab group to represent Earth's total amount of water. They divide the water into smaller containers, each representing one of those reservoirs. The...
Math Worksheets Land
Pie or Circle Graphs—Step-by-Step Lesson
How do you display data that you've collected in a pie chart? Follow a clear step-by-step guide to turning survey results into a visible format. It shows kids how to determine the percentage of the whole that each section represents.
Math Worksheets Land
Patterns of Association (Using Data Tables) - Guided Lesson
The activity belongs to a four-part resource that applies percentages to data tables. The page has three practice problems that continues with the development of this topic.
Other popular searches
- Teaching Percentages
- Figuring Percentages
- Calculating Percentages
- Basic Money Percentages
- Math Percentages
- Markup Percentages
- Discount Percentages
- Decimals and Percentages
- Percentages and Math
- Math Lessons on Percentages
- Circle Percentages
- Percentages of Quantities


