Texas Instruments
Texas Instruments: Exploring the Pythagorean Theorem and Its Applications
Students discover the Pythagorean Theorem by exploring right triangles using Cabri Jr. They apply the Pythagorean Theorem to real-world problems. Also, students create a scatter plot of the data and find an equation that fits the data.
Texas Instruments
Texas Instruments: Maximizing the Area of a Rectangle
This activity is adapted from one of the TI books. Students measure lengths and widths of rectangles and record for the class to see. Each group's rectangle has the same perimeter, but different areas. After a discussion, students make...
Texas Instruments
Texas Instruments: Numb3 Rs: Prime Time
Based off of the hit television show NUMB3RS, this lesson helps students understand the Goldbach Conjecture (any even number greater than four can be written as the sum of two odd prime integers). Students explore how many pairs of odd...
Science Education Resource Center at Carleton College
Serc: Average Rates of Change and Trend Lines
In this Spreadsheets Across the Curriculum activity, students calculate the average rate of change and graph a scatter plot of status high school dropout rate for 1975-2002. The module combines interpretation of rate of change in the...
Khan Academy
Khan Academy: Interpreting Slope and Y Intercept of Lines of Best Fit
Practice explaining the meaning of slope and y-intercept for lines of best fit on scatter plots. Students receive immediate feedback and have the opportunity to try questions repeatedly, watch a video, or receive hints.
Texas Instruments
Texas Instruments: The Normal Distribution
Students graph normal distributions, shade desired areas, and find related probabilities. They graph Normal probability scatter plots to check the normal (linear) shape of a data distribution.
CK-12 Foundation
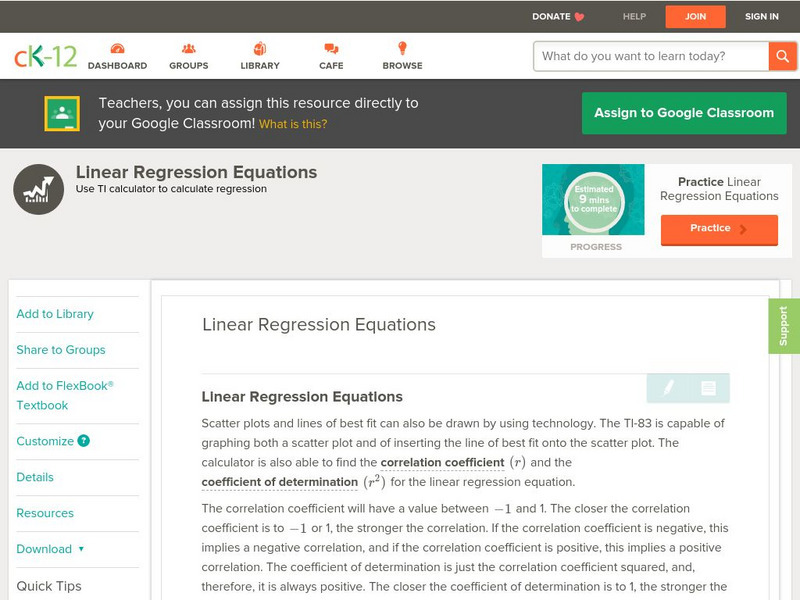
Ck 12: Statistics: Linear Regression Equations
[Free Registration/Login may be required to access all resource tools.] Use a calculator to create a scatter plot and to determine the equation of the line of best fit.
Khan Academy
Khan Academy: Linear Regression Review
Linear regression is a process of drawing a line through data in a scatter plot. The line summarizes the data, which is useful when making predictions.
Khan Academy
Khan Academy: Correlation Coefficient Review
The correlation coefficient r measures the direction and strength of a linear relationship. Calculating r is pretty complex, so we usually rely on technology for the computations. We focus on understanding what r says about a scatterplot.
Purple Math
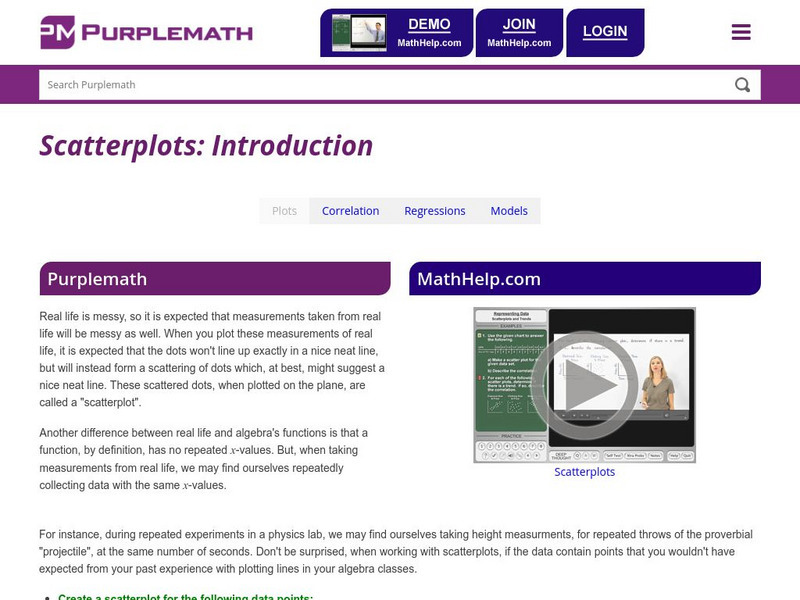
Purplemath: Scatterplots and Regressions
Explains the purpose of scatterplots, and demonstrates how to draw them.
Other
Stat Soft: Statistics Glossary
Dozens of statistical terms are defined and illustrated in this glossary.
Rice University
Hyper Stat Online Statistics Textbook: Chapter 3: Describing Bivariate Data
This chapter of an online textbook begins with a description of scatterplots, then focuses on the Pearson Product Moment Correlation.
Texas Instruments
Texas Instruments: Boat Registration and Manatee Deaths in Florida
Students will explore the data on boat registrations and manatee deaths in Florida. They will use the data, the graph of the data and the line of best fit to make predictions about the relationship of the data.
University of Georgia
University of Georgia: Definitions in Statistics
This site contains definitions to use in statistics and ways to collect data.
Duke University
Duke University: Introduction to Linear Regression
This page discusses linear regression, its equations, background, and applications. Provides questions, answers, formulas, and explanations for understanding.
Texas Instruments
Texas Instruments: Applications of Integrals
Use the TI-89 to find the area between curves, find arc length, and solve first and second order differential equations. Examples in the activity use calculator screenprints and keystroke instructions to demonstrate the use of the...
Texas Instruments
Texas Instruments: Numb3 Rs: Dialing Ben
Based off of the hit television show NUMB3RS, this lesson has students try to discover if there has been a significant change in cell phone use over the course of ten days. If so, this "change point" can be detected by creating a line of...
CK-12 Foundation
Ck 12: Algebra: Factoring When the Leading Coefficient Equals 1
[Free Registration/Login may be required to access all resource tools.] This lesson covers factoring quadratics when the leading coefficient is 1.
Sophia Learning
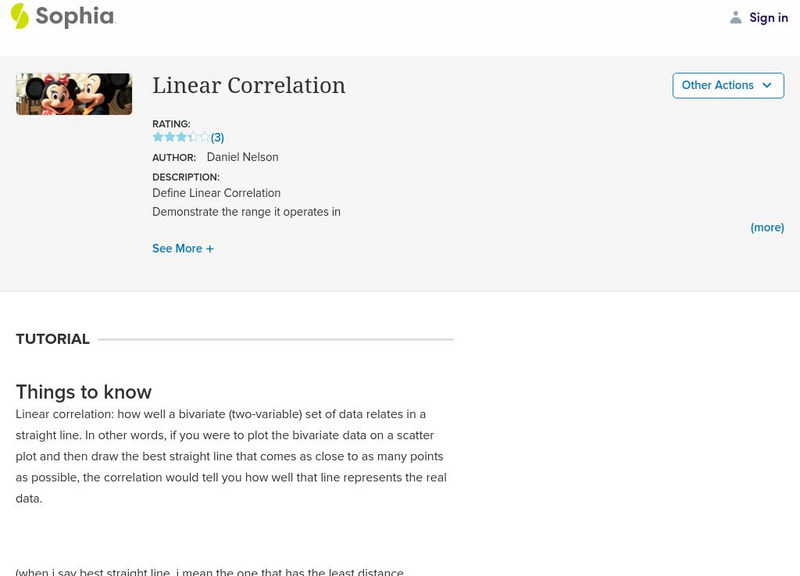
Sophia: Linear Correlation Tutorial
Use examples to determine and explain the linear correlation of independent and dependent variables.
Illustrative Mathematics
Illustrative Mathematics: S Id, F if Laptop Battery Charge
This task uses a situation that is familiar to students to solve a problem they probably have all encountered before: How long will it take until an electronic device has a fully charged battery? Given data, students perform a variety of...
CK-12 Foundation
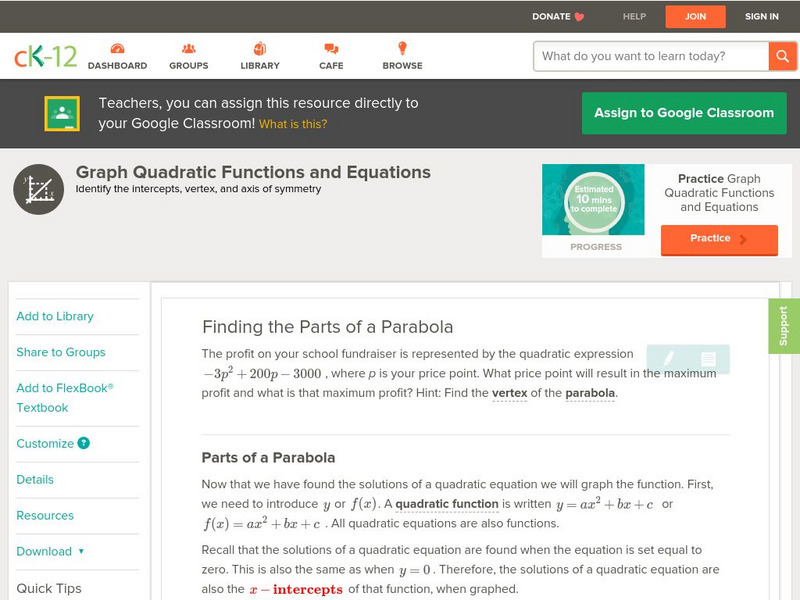
Ck 12: Algebra: Quadratic Functions and Their Graphs
[Free Registration/Login may be required to access all resource tools.] Learn the anatomy of the graph of a quadratic function.
CK-12 Foundation
Ck 12: Statistics: Least Squares Regression
[Free Registration/Login may be required to access all resource tools.] This Concept introduces students to least-squares regression.
Alabama Learning Exchange
Alex: Ballistic Statistics!
Students will collect examples of various statistical instruments and form an electronic scrapbook. These materials will be gathered from electronic sources in addition to periodicals and other print resources.
Alabama Learning Exchange
Alex: Statistically Thinking
The object of this project is for students to learn how to find univariate and bivariate statistics for sets of data. Also, the students will be able to determine if two sets of data are linearly correlated and to what degree. The...
Other popular searches
- Creating a Scatter Plot
- Scatter Plot Graphs
- Math Scatter Plots
- Scatter Plot Project
- Scatter Plot Trend Line
- Algebra Scatter Plots
- Creating Scatter Plots
- Scatter Plot Worksheets
- Correlating Scatter Plot
- Candy Scatter Plots
- Scatter Plot Notes
- Data for Scatter Plots


