EngageNY
Modeling an Invasive Species Population
Context makes everything better! Groups use real data to create models and make predictions. Classmates compare an exponential model to a linear model, then consider the real-life implications.
EngageNY
Transformations of the Graphs of Logarithmic and Exponential Functions
Transform your lesson on transformations. Scholars investigate transformations, with particular emphasis on translations and dilations of the graphs of logarithmic and exponential functions. As part of this investigation, they examine...
EngageNY
An Appearance of Complex Numbers 1
Complex solutions are not always simple to find. In the fourth lesson of the unit, the class extends their understanding of complex numbers in order to solve and check the solutions to a rational equation presented in the first lesson....
EngageNY
Justifying the Geometric Effect of Complex Multiplication
The 14th lesson in the unit has the class prove the nine general cases of the geometric representation of complex number multiplication. Class members determine the modulus of the product and hypothesize the relationship for the...
EngageNY
Equations Involving a Variable Expression in the Denominator
0/0 doesn't equal 0! Begin this lesson by allowing the class to explore the concept of dividing by zero. The introduction allows for discovery and provides meaningful examples of dividing by zero. This understanding leads to solving...
EngageNY
Newton’s Law of Cooling
As part of an investigation of transformations of exponential functions, class members use Newton's Law of Cooling as an exponential model to determine temperature based on varying aspects. The resource makes comparisons between models...
EngageNY
Congruence Criteria for Triangles—SAS
Looking for a different approach to triangle congruence criteria? Employ transformations to determine congruent triangles. Learners list the transformations required to map one triangle to the next. They learn to identify congruence if...
EngageNY
Graphing Quadratic Functions from the Standard Form
Use context to explain the importance of the key features of a graph. When context is introduced, the domain and range have meaning, which enhances understanding. Pupils use application questions to explore the key features of the graph...
EngageNY
Representing, Naming, and Evaluating Functions (Part 2)
Notation in mathematics can be intimidating. Use this instructional activity to expose pupils to the various ways of representing a function and the accompanying notation. The material also addresses the importance of including a domain...
EngageNY
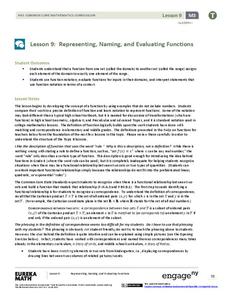
Representing, Naming, and Evaluating Functions (Part 1)
Begin the discussion of domain and range using something familiar. Before introducing numbers, the lesson uses words to explore the idea of input and outputs and addresses the concept of a function along with domain and range.
EngageNY
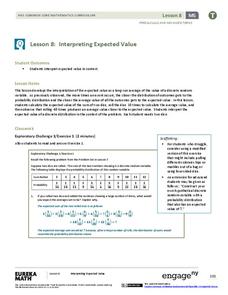
Interpreting Expected Value
Investigate expected value as a long-run average. The eighth installment of a 21-part module has scholars rolling pairs of dice to determine the average sum. They find aggregate data by working in groups and interpret expected value as...
EngageNY
The Graph of a Linear Equation in Two Variables
Add more points on the graph ... and it still remains a line! The 13th installment in a series of 33 leads the class to the understanding that the graph of linear equation is a line. Pupils find several solutions to a two-variable linear...
EngageNY
Comparison of Numbers Written in Scientific Notation and Interpreting Scientific Notation Using Technology
Examine numbers in scientific notation as a comparison of size. The 14th lesson in the series asks learners to rewrite numbers as the same power of 10 in scientific notation to make comparisons. Pupils also learn how to use a calculator...
EngageNY
Angles Associated with Parallel Lines
Explore angle relationships created by parallel lines and transversals. The 13th lesson of 18 prompts scholars use transparency paper to discover angle relationships related to transversals. Learners find out that these angles pairs are...
EngageNY
The Computation of the Slope of a Non-Vertical Line
Determine the slope when the unit rate is difficult to see. The 17th part of a 33-part series presents a situation that calls for a method to calculate the slope for any two points. It provides examples when the slope is hard to...
EngageNY
Representations of a Line
Explore how to graph lines from different pieces of information. Scholars learn to graph linear functions when given an equation, given two points that satisfy the function, and when given the initial value and rate of change. They solve...
EngageNY
Selecting a Sample
So what exactly is a random sample? The 15th part in a series of 25 introduces the class to the idea of selecting samples. The teacher leads a discussion about the idea of convenient samples and random samples. Pupils use a random...
EngageNY
Percent of a Quantity
Visualize methods of finding percents. Classmates find a percent of a quantity using two methods including a visual model in the 26th lesson in a series of 29. By the end of the lesson, scholars find percents given a part and the whole...
EngageNY
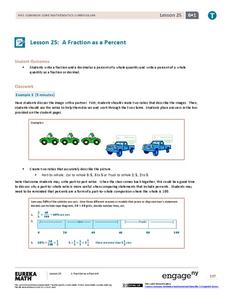
A Fraction as a Percent
It is all about being equivalent. Class members convert between fractions, decimals, and percents. By using visual models, scholars verify their conversions in the 25th portion of a 29-part series.
EngageNY
Describing the Center of a Distribution Using the Median
Find the point that splits the data. The instructional activity presents to scholars the definition of the median through a teacher-led discussion. The pupils use data lists and dot plots to determine the median in sets with even and odd...
Channel Islands Film
A Time Capsule of a Lost Early California Lifestyle
After viewing The Last Roundup, a documentary that examines the transitioning of Santa Rosa from a privately owned island to a National Park, class members adopt the point of view of Tim Vail, a member of the family that once owned the...
EngageNY
Tables of Equivalent Ratios
Don't table the discussion on equivalent ratios — do it now! Scholars create tables of equivalent ratios to represent contextual problems. Pupils go on to use the tables to answer questions within the context. The lesson is ninth in a...
Minnesota Literacy Council
Introduction to Historical Thinking
Christopher Columbus: hero or villain? Prepare class members for the debate with activities that asks them to think critically about how history is reported.
Kenan Fellows
Math Made Simple as 1-2-3: Simplified Educational Approach to Algebra
Writing an equation of a line is as easy as m and b. A lesson presentation gives individuals different strategies for writing equations of lines. Some items provide a slope and a point while others provide two points. Whatever the given,...


