Virginia Department of Education
Molar Heat of Fusion for Water
How can you describe heat of fusion in a way the class understands and relates the importance of this concept to present day issues? In this third lesson of the series, learners conduct an experiment, demonstrating the flow of heat...
Curated OER
Designing the Experiment and Answering the Question
Students investigate scientific methods by analyzing an article from the Natural Inquirer. In this data analysis lesson plan, students read an article from the magazine and discuss at least 2 scientific methods that could be used to...
Curated OER
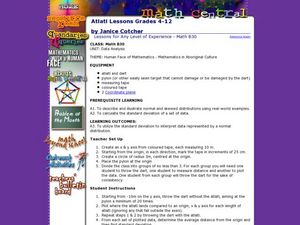
Human Face of Mathematics - Mathematics in Aboriginal Culture
Students collect statistical data. In groups, students play a dart game and then determine the distance between darts. They collect the data and plot the information on a coordinate plane. They identify the mean and the standard...
Bowland
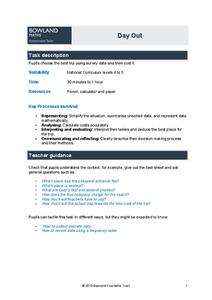
Day Out
Use mathematics to help plan a field trip. Scholars use the results of a survey to determine where a class should go on a field trip. They use provided data about entrance fees and mileage to calculate the cost per person of such a trip.
Curated OER
Bar Graphs and Survey Questions- Internet Access
In this graphing and data collection activity, students examine a bar chart that show data collected from 1998 - 2006 that shows the percentage of households that have Internet access. They answer questions based on the chart and make...
Curated OER
How Does Your Tree Measure Up?
Middle schoolers work in pairs or small groups to gather data about a tree. Each group might gather data about a different tree; all groups might collect data about the same tree; or two teams might gather data about each tree and...
Curated OER
Making Numbers Manageable
Eighth graders recognize and express numbers when written in time saving techniques. They gather data from a variety of sources, including print and electronic media. They develop a presentation using a variety of techniques.
Virginia Department of Education
Analyzing and Interpreting Statistics
Use measures of variance to compare and analyze data sets. Pupils match histograms of data sets to their respective statistical measures. They then use calculated statistics to further analyze groups of data and use the results to make...
NASA
Speaking in Phases
Hear from deep space. Pupils learn how satellites transfer information back to Earth. They learn about three different ways to modulate radio waves and how a satellite sends information with only 0s and 1s. Using sound, class members...
Curated OER
Student Census
Students collect data from their peers and store the information in a database. As students manage the information they realize the usefulness of a database as a tool to manage large amounts of information in an efficient and accurate...
Normal Community High School
Golf Ball Lab
The first golf balls were made of wood and would only last for a few games. Modern golf balls last a lot longer but they don't float. The presentation provides the directions for a lab to determine the minimum amount of salt needed to...
Curated OER
Water Down the Drain
Did you know that leaky faucets waste $10 million worth of water? Conservationists perform an experiment and draw best-fit lines to explore how the US Geological Society determined this value.
Curated OER
Saving Energy Through Ecological Landscape Design
Students are able to transcribe to scale the plant features of a common landscape. They determine true north and south and collect and record data on a table. Students calculate a rating for and describe a definition of insulation and...
Curated OER
Data Collection and Record Keeping. Measuring Larval Growth and Development
Students keep data records of the growth of Monarch larvae. The observations are made with the change of each stage of development. The observations are to stimulate the answering of questions about biological development.
Curated OER
Texas Industries Then and Now
Middle schoolers identify contemporary economic counterparts to industries featured in Texas bird's-eye views by using this website and a "Goods and Services Data Collection Sheet."
Curated OER
Bones and Math
students identify and explore the connection between math and the bones of the human body. Students collect data about bones from their classmates and from adults, apply formulas that relate this data to a person's height, and organize...
Curated OER
Scientific Investigation- Magnets
Students conduct a scientific investigation to determine if a magnet attracts paper clips through different materials. Students write out their procedures, collect data and present it in a table or chart, and analyze their results.
Curated OER
Mapping The Ocean Floor
Young scholars explore and analyze the bottom structure of underwater habitats. They describe and explain what can't see through the collection and correlation of accurate data. Learners assess that technology is utilized as a tool for...
Curated OER
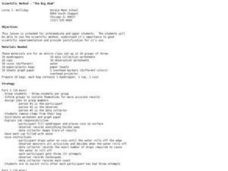
Scientific Method- "The Big Ahah"
Students experiment with water, dropper and a coin to study the scientific method. In this scientific method lesson plan, students are in groups, each with a coin, water and a dropper. They investigate how many drops of water can fit on...
Curated OER
Calculating Profits from Selling Virtual Lemonade
Students set up and collect data for a virtual lemonade stand. In this entrepreneurship, economics, and technology lesson, students purchase ingredients, determine costs, and set up a virtual lemonade stand. Students consider weather...
Curated OER
Circles and Cylinders
In this circles and cylinders worksheet, 10th graders solve and complete 22 various types of problems. First, they collect data for a radius and circumference for several different circles and calculate the quantity. Then, students find...
Curated OER
Temperature Bar Graph
Students explore mean, median and mode. In this math lesson, students analyze temperature data and figure the mean, median, and mode of the data. Students graph the data in a bar graph.
Curated OER
Wildlife and Highway Management
Students create a research questions about animal underpasses and how animals use them. In this animals lesson plan, students use their collected data to answer their question.
Curated OER
Student Heights
Students measure the heights of their fellow classmates and create a box and whisker plot to display the data. In this measurement lesson plan, students analyze the data and record results.


